Pricing
Request a Free Audit

Share of Voice in Advertising: 2026 Measurement Guide

share-of-voice-advertising-dashboard-channel-comparison

Share of voice advertising,

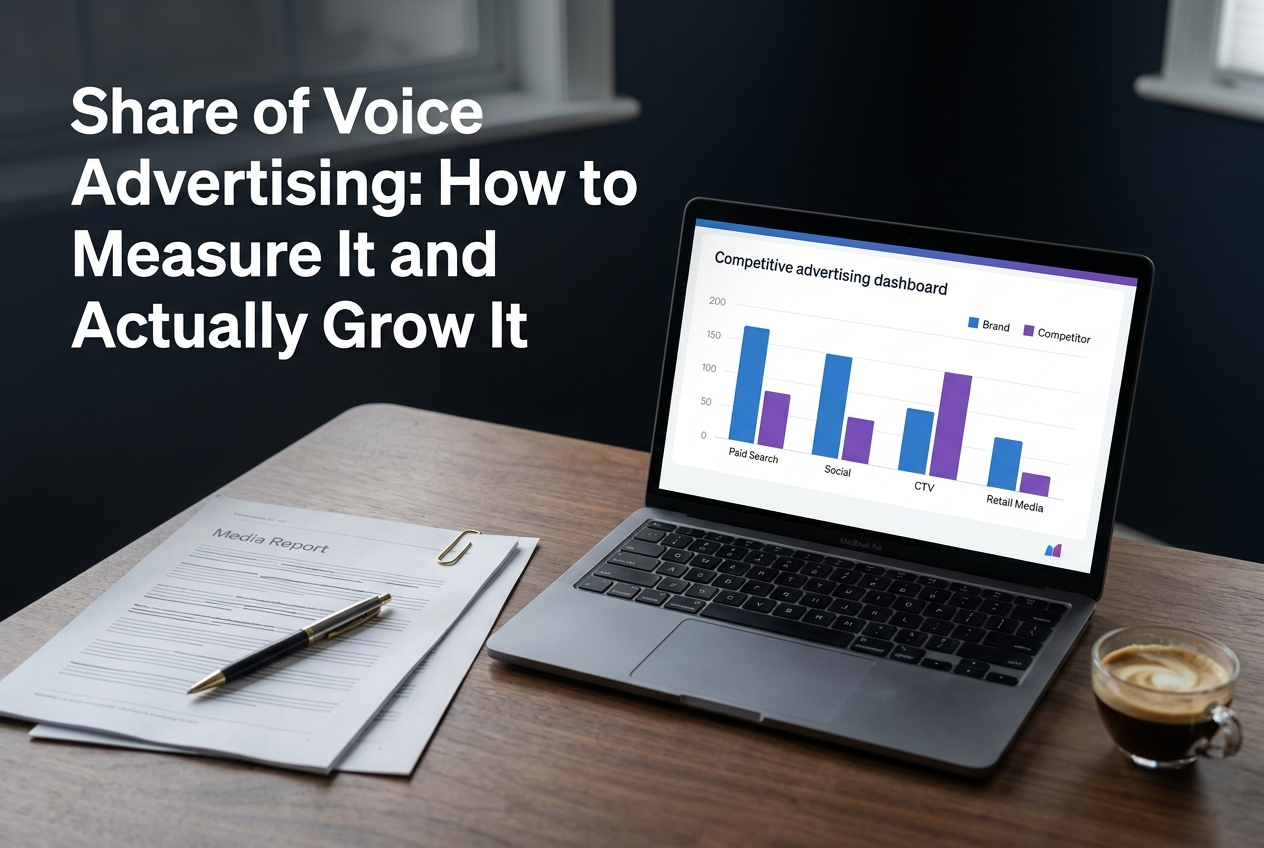
Share of voice in advertising is the percentage of total advertising exposure your brand owns within a defined market, compared to your competitors. It’s calculated by dividing your brand’s advertising activity (spend, impressions, or mentions) by the total advertising activity in your category, then multiplying by 100. A brand spending $2 million in a market where total category ad spend is $20 million has a 10% share of voice.

That’s the textbook answer. But in 2026, advertising SOV has expanded well beyond media budgets. It now spans paid search impression share, social ad visibility, programmatic display, connected TV, retail media networks, and even how often your brand appears in AI-generated shopping recommendations. If you’re only measuring spend, you’re measuring an input, not the outcome that actually matters, which is whether your audience sees you more than they see your competitors.

This guide breaks down how to calculate advertising SOV across every channel that matters right now, what benchmarks to aim for, where most measurement approaches fall short, and the specific tactics that move the number without just throwing more budget at it.

What You’ll Learn

  • The advertising SOV formula and how it changes by channel
  • Why the relationship between SOV and market share still holds, with caveats
  • Channel-by-channel measurement methods for paid search, social, display, CTV, and retail media
  • How to set realistic SOV targets based on your growth stage
  • Five tactics that grow advertising share of voice without proportional budget increases
Share Of Voice Advertising, share-of-voice-advertising-dashboard-channel-comparison
Advertising SOV measured across five channels reveals where your brand dominates and where competitors outspend you.

The Advertising SOV Formula, And Why One Formula Isn’t Enough

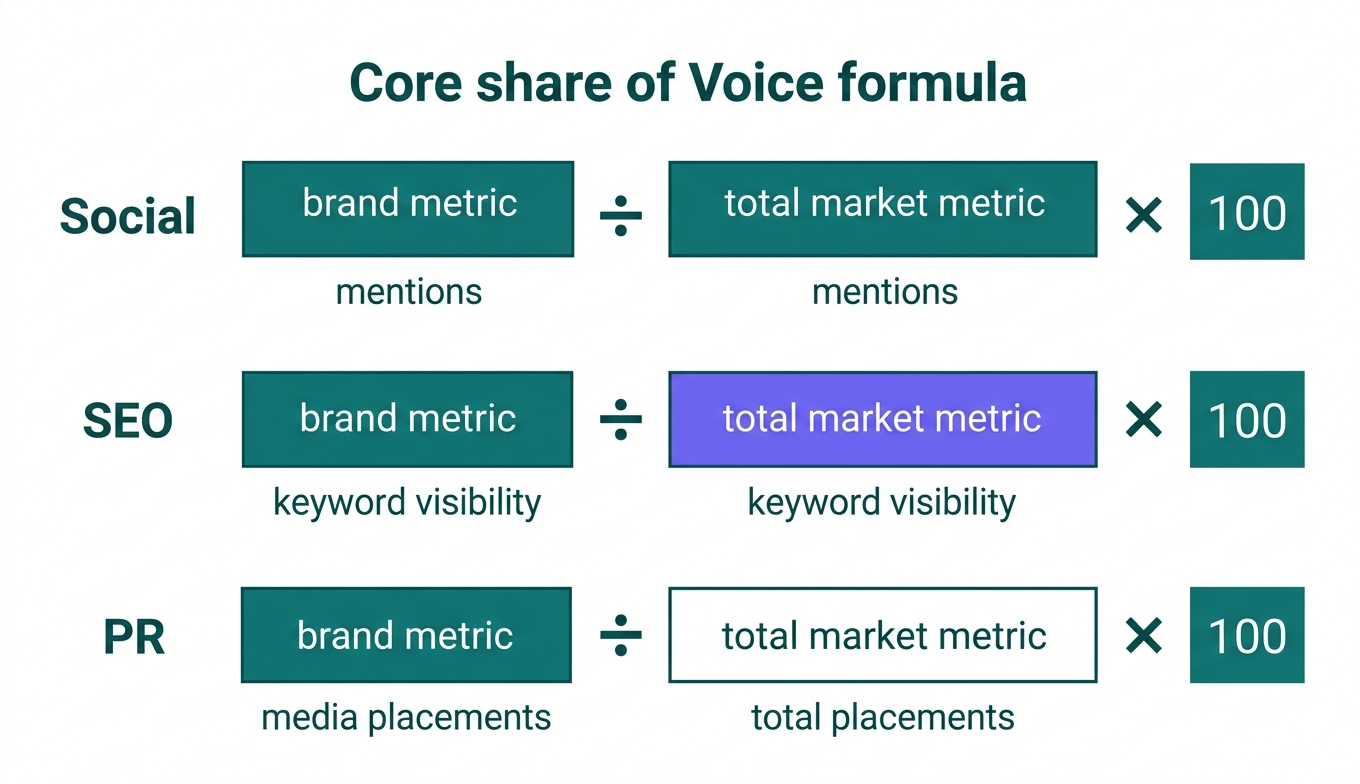
The classic share of voice formula is simple:

SOV = (Your Brand’s Advertising Metric รท Total Market Advertising Metric) ร— 100

The problem is that “advertising metric” means something different on every channel. Spend-based SOV was fine when brands competed mainly across TV, radio, and print. You’d compare your media budget to total category spend and get a clean picture.

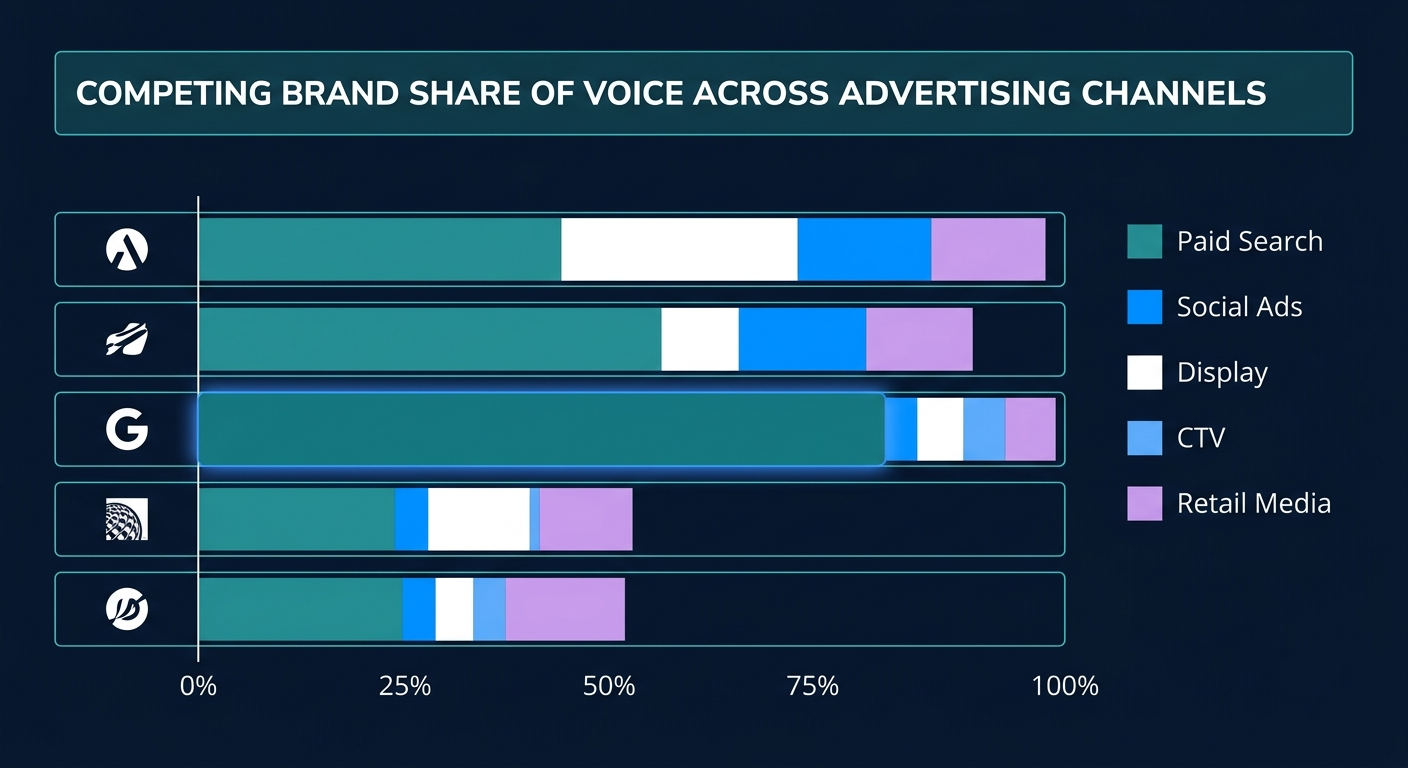
That picture is now incomplete. A brand could outspend competitors on linear TV and still lose advertising share of voice in the channels where their buyers actually make decisions, paid search, social feeds, retail media placements, streaming pre-rolls.

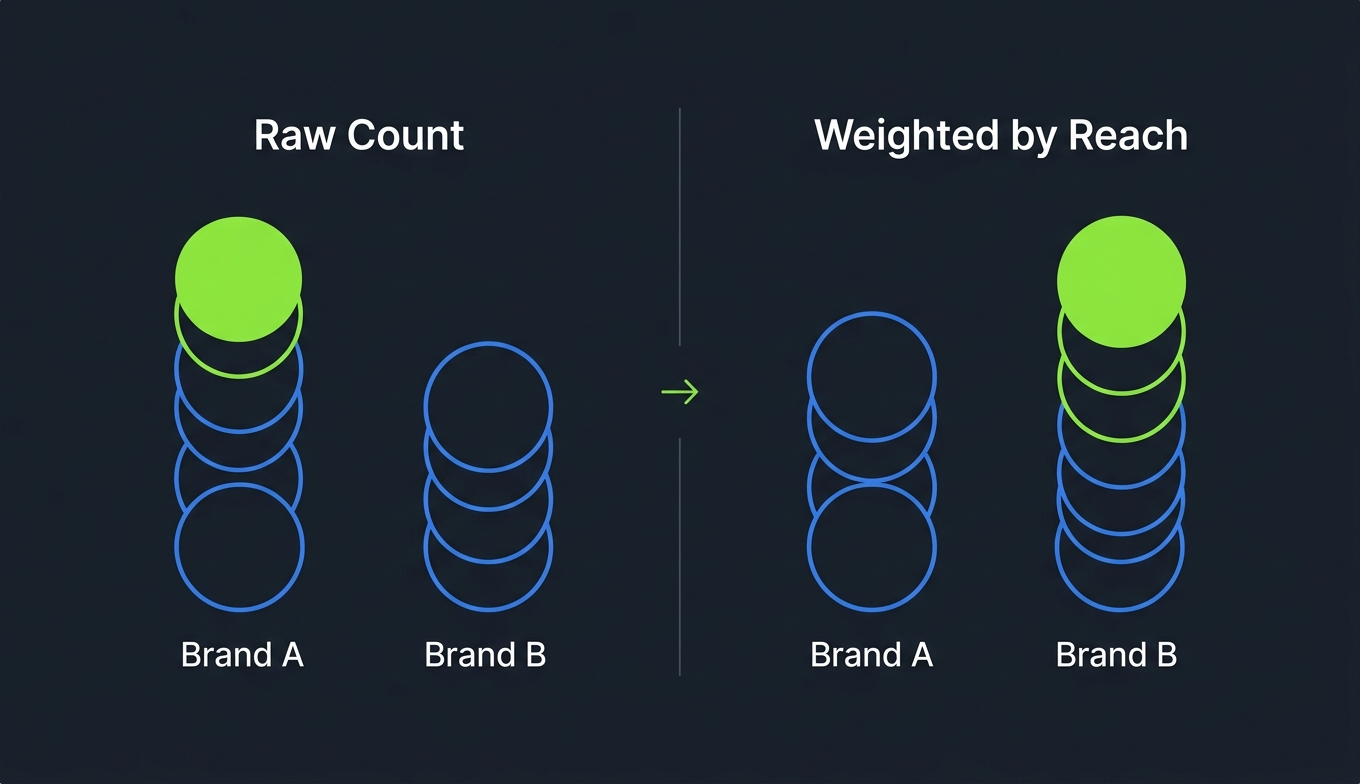
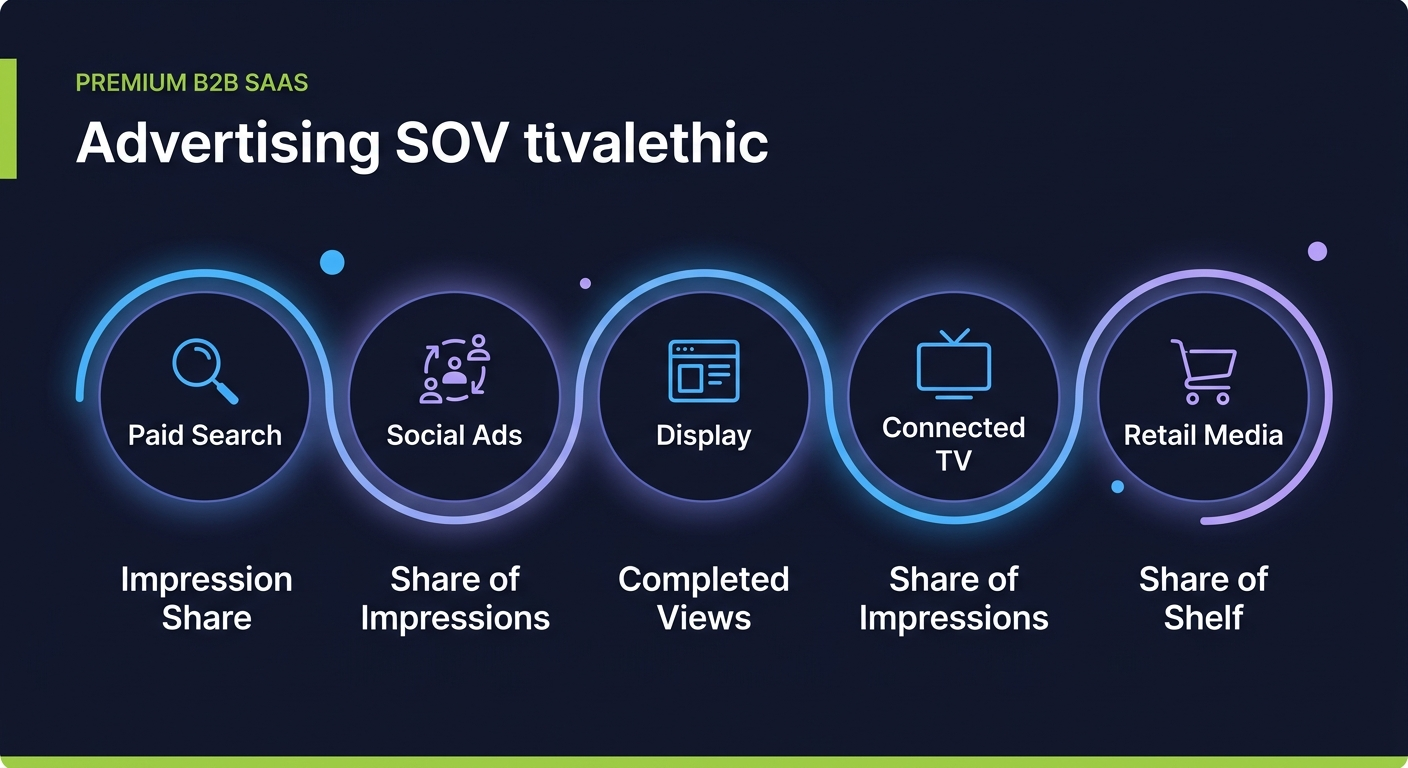
Advertising share of voice in 2026 should be measured by the metric that reflects actual audience exposure on each channel: impressions for display and social, impression share for paid search, completed views for CTV, and share of shelf for retail media.

Here’s what that looks like in practice:

Channel Best SOV Metric Where to Find It
Paid search (Google/Bing) Impression share Google Ads Auction Insights, Microsoft Ads
Social ads (Meta, LinkedIn, TikTok) Share of impressions in category Ad library scraping tools, competitive intelligence platforms
Programmatic display Share of impressions served DSP reporting, Moat, DoubleVerify
Connected TV / streaming Share of completed views Platform dashboards, Nielsen Ad Intel, iSpot
Retail media (Amazon, Walmart) Share of shelf / share of search Profitero, Pacvue, Skai
Traditional (TV, radio, print, OOH) Estimated spend share Nielsen Ad Intel, Vivvix, MediaRadar

Using the wrong metric for a channel is a quiet way to deceive yourself. High spend on connected TV means nothing if your completion rates are low and a competitor’s pre-rolls are running uninterrupted. Measure what the audience experienced, not what you paid for.

SOV and Market Share: The Relationship That Refuses to Die

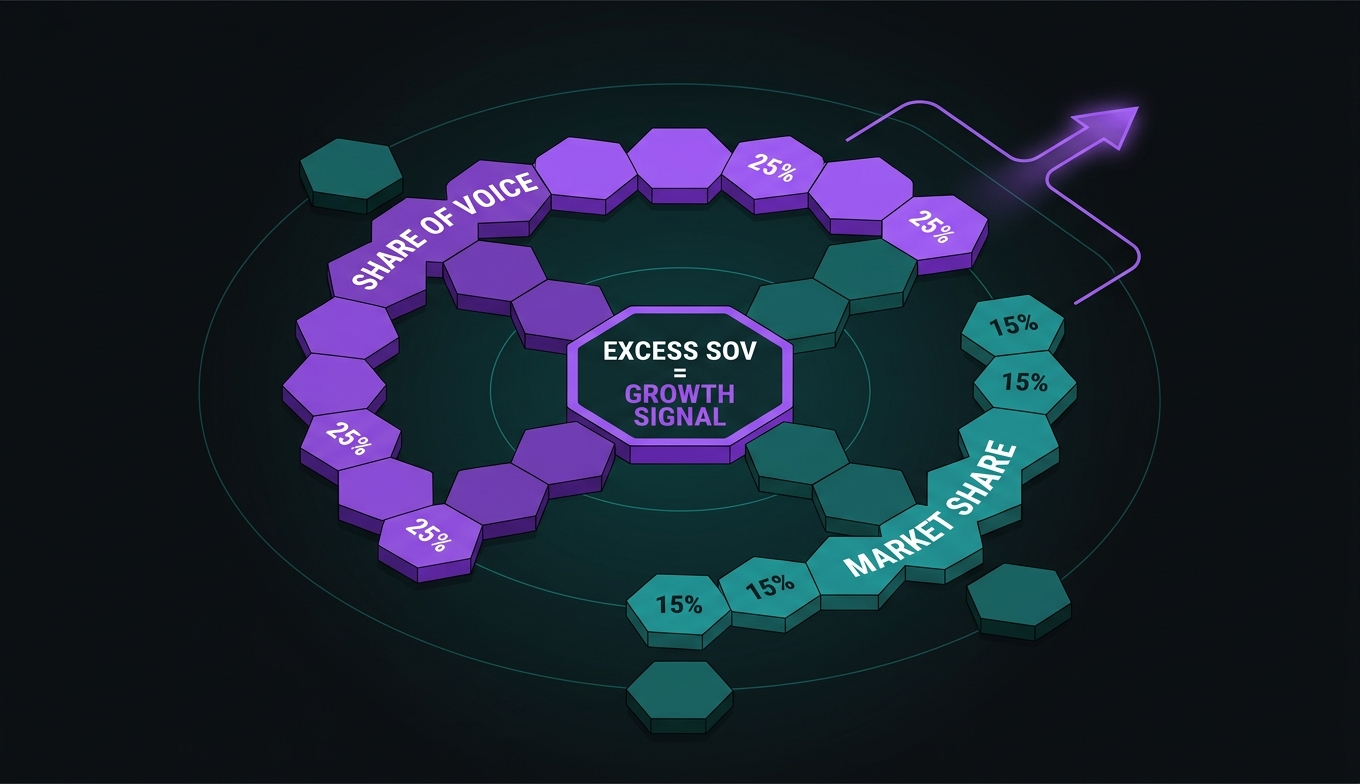
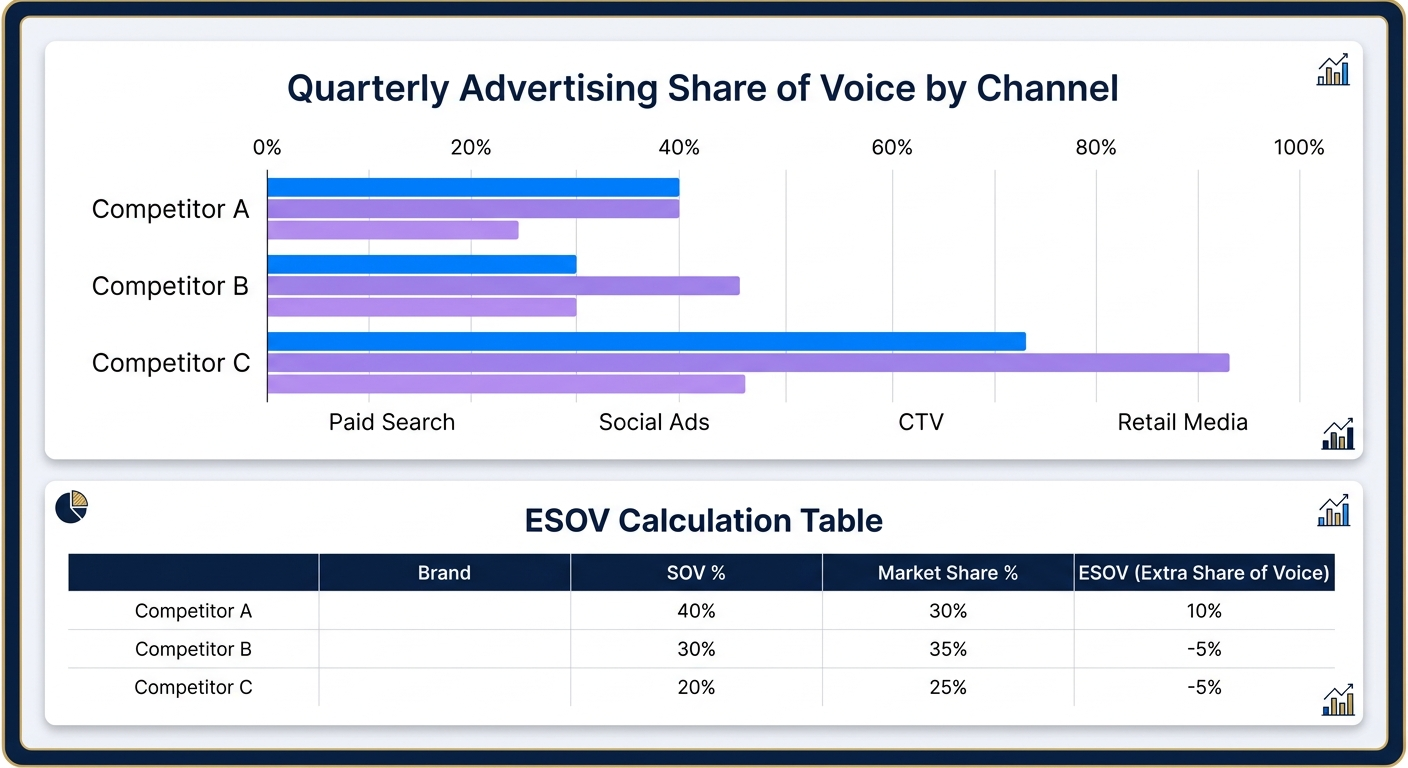
The most-cited finding in advertising effectiveness research comes from Les Binet and Peter Field. Their analysis of IPA Databank campaigns found that brands with excess share of voice, where SOV exceeds current market share, tend to grow, while brands whose SOV falls below their market share tend to shrink. The rate: roughly 0.5% market share gain for every 10 percentage points of ESOV, based on their study of 171 campaigns from 1980, 2010.

That finding is over a decade old. Does it still hold?

Mostly, yes, but with sharper conditions than most summaries acknowledge. The effect varies by category maturity, brand size, and media mix. Challenger brands in fast-moving categories tend to see stronger returns from excess SOV. Market leaders in stable categories often see diminishing returns. And the original research measured traditional media; the principle extends to digital, but the multiplier isn’t guaranteed to transfer cleanly across programmatic display or retail media.

The practical takeaway for 2026: ESOV is a useful growth signal, not a law of physics. If your advertising SOV is 12% and your market share is 18%, you’re probably coasting on existing brand equity. If it’s 22% and your market share is 14%, you’re investing ahead of the curve. Neither situation tells you whether you’re spending in the right channels. That’s where the channel-level breakdown earns its value.

How to Calculate Advertising SOV by Channel

Google Ads provides impression share directly in the Auction Insights report. It’s the percentage of impressions your ads received out of the total impressions you were eligible for. You can segment by campaign, ad group, or keyword.

This is one of the cleanest SOV signals available because Google does the denominator math for you. If your impression share on your top 20 brand and category keywords is 65%, you’re visible for about two-thirds of eligible searches. Your competitors split the remaining 35%.

Two things to watch: impression share lost to budget (you ran out of money) versus lost to rank (your ad quality or bid wasn’t competitive enough). They require completely different fixes. Budget constraints need budget reallocation or tighter targeting. Rank losses need better landing pages, ad relevance, or bid strategy.

Social advertising SOV

No social platform serves up a native “share of voice” dashboard for ads. Measuring social ad SOV requires combining your own campaign data with competitive intelligence from tools like Pathmatics, Socialbakers, or manual monitoring through Meta’s Ad Library and TikTok’s Creative Center.

The most practical approach: compare your brand’s estimated impressions across a defined keyword or product category against the estimated total impressions from all advertisers in that space. It won’t be precise to the decimal, but directionally, it reveals whether you’re being outspent or out-targeted.

Social ad SOV matters most for consideration-stage visibility. If three competitors are running retargeting sequences against your audience and you’re not, their brands are getting repeated exposure while yours fades. That gap compounds.

Connected TV and streaming

CTV ad spend is growing faster than any other channel in 2026. Measuring SOV here means tracking share of completed views, not just spend. A brand buying cheaper inventory with high skip rates may spend more but still lose share of voice to a competitor running fewer, unskippable placements on premium inventory.

advertising-sov-metrics-by-channel-overview
Each advertising channel requires a different metric to accurately capture your share of voice.

Nielsen Ad Intel, iSpot.tv, and VideoAmp are the primary data sources. CTV SOV matters because this channel drives upper-funnel brand recall in a way that display rarely achieves. Losing share here shows up months later in organic search volume and consideration-set data.

Retail media networks

For brands selling through Amazon, Walmart, Instacart, or other retail platforms, share of voice increasingly means share of shelf, the percentage of search results and product listing pages where your brand’s sponsored placements appear versus competitors.

This is one of the fastest-growing SOV battlegrounds. When a shopper searches “wireless earbuds” on Amazon and your competitor’s sponsored products occupy three of the top five slots, their advertising SOV on that query is 60%. Yours might be zero. Tools like Pacvue, Skai, and Profitero track this across retail platforms.

Traditional media

TV, radio, print, and out-of-home SOV still relies primarily on estimated spend share. Nielsen Ad Intel and Vivvix are the standard sources in the U.S. The data is lagged (often by weeks or months), but it’s still the most reliable view of how your budget stacks up against category competitors in traditional channels.

Traditional media SOV is increasingly a supporting signal rather than the primary one. But for brands in categories where TV still drives significant reach, automotive, insurance, furniture, QSR, it remains a core competitive benchmark.

What “Good” Looks Like: Setting SOV Targets

One of the biggest gaps in most SOV guides is benchmarking. Everyone explains the formula. Almost nobody tells you what number to aim for.

The honest answer: it depends on whether you’re defending or attacking.

Market leaders (top 3 in category) should target SOV that roughly matches their market share. If you hold 25% market share, an advertising SOV between 22, 28% maintains your position without overspending. Dropping significantly below market share signals vulnerability, competitors are investing to take what you have.

Challenger brands (outside top 3, actively growing) need excess SOV. The Binet and Field research suggests that ESOV of 8, 15 percentage points above your current market share is the growth corridor. So if you hold 8% market share, you’d aim for 16, 23% SOV. That sounds expensive, and it is. The question is whether you can achieve it through smarter channel allocation rather than raw budget increases.

Niche or startup brands (under 5% market share) shouldn’t think about total category SOV at all. You can’t win the whole market. Instead, measure SOV within specific subcategories, geographies, or audience segments where you can credibly dominate. A brand with 2% national market share can achieve 40% SOV in a single metro area or product subcategory, and that concentrated visibility drives disproportionate growth.

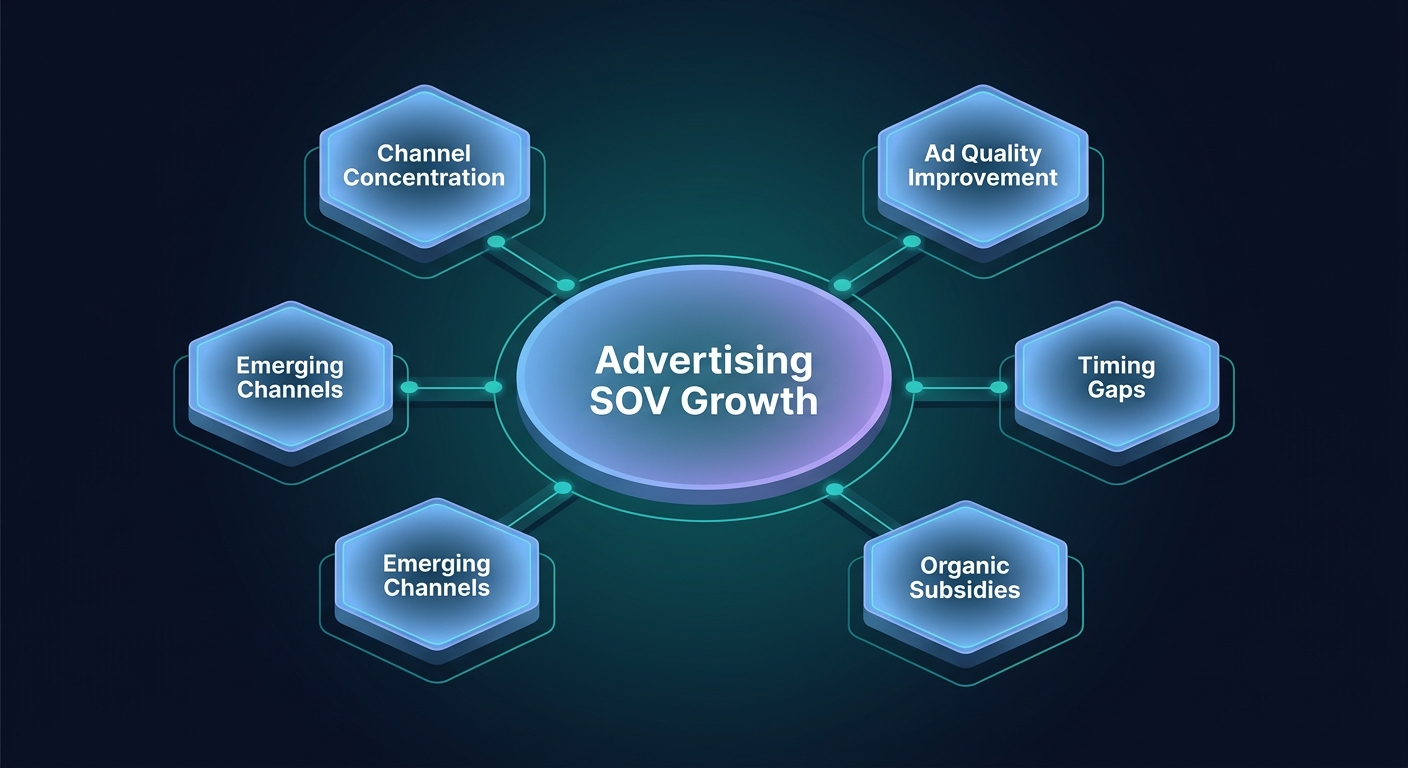
Five Ways to Grow Advertising SOV Without Just Spending More

Most SOV advice boils down to “increase your budget.” That’s technically correct and practically useless for the vast majority of marketing teams. Here’s what actually moves the dial.

Concentrate spend on fewer, higher-impact channels

Spreading budget across seven channels guarantees mediocre SOV on all of them. Pick two or three channels where your audience is most reachable and your competitors are weakest, and build dominant share there. A 35% SOV on paid search and social for your core category keywords does more work than a 7% SOV spread across everything.

This requires knowing where your competitors are spending, and where they’re not. Competitive analysis isn’t optional here. It’s the foundation of every channel allocation decision.

Improve ad quality scores and relevance

On paid search, higher Quality Scores mean lower costs per impression. On Meta, higher relevance scores mean more efficient delivery. On programmatic, better creative performance means your budget stretches further. All of these effectively increase your SOV without increasing your spend.

This is where most brands leave the most money on the table. A 15% improvement in ad quality scores across your Google Ads account can increase your impression share by 10, 20% at the same budget. That’s free SOV.

Target timing gaps

Most competitors run ads during the same hours, days, and seasons. If you can identify periods when competitive intensity drops, early mornings, weekends, off-peak months, you can buy more share of voice at lower cost.

Dayparting analysis across your paid search and social campaigns often reveals that impression share jumps significantly during off-peak hours simply because fewer competitors are bidding. Schedule your spend to exploit those gaps.

Use organic to subsidize paid

Strong organic search visibility reduces the pressure on paid search to carry your entire SOV. If you rank organically for 60% of your target keywords, you can concentrate paid spend on the 40% where organic visibility is weak. The combined effect, paid plus organic, gives you a higher total advertising and search presence than either channel alone.

This is why SEO competitor analysis feeds directly into advertising SOV strategy. They’re not separate workstreams. They’re the same visibility goal measured in two ways.

Build share of voice in emerging channels before competitors catch up

Retail media networks, CTV, and audio advertising are still underpenetrated relative to search and social. Early investment in these channels can deliver disproportionate SOV because the auction dynamics are less competitive. The brands building CTV share of voice right now are locking in audience familiarity that will be far more expensive to buy in two years.

five-tactics-to-grow-advertising-share-of-voice
Growing advertising SOV isn’t always about spending more, it’s about spending smarter across these five levers.

Common Measurement Mistakes That Distort Advertising SOV

Getting the formula right is easy. Getting the inputs right is where most teams fail.

Mistake 1: Defining the market too broadly. If you sell enterprise project management software and you measure SOV against the entire “SaaS” category, your number will be tiny and meaningless. Define your competitive set tightly, the 5, 10 brands your buyers actually compare you against. SOV is only useful relative to a meaningful denominator.

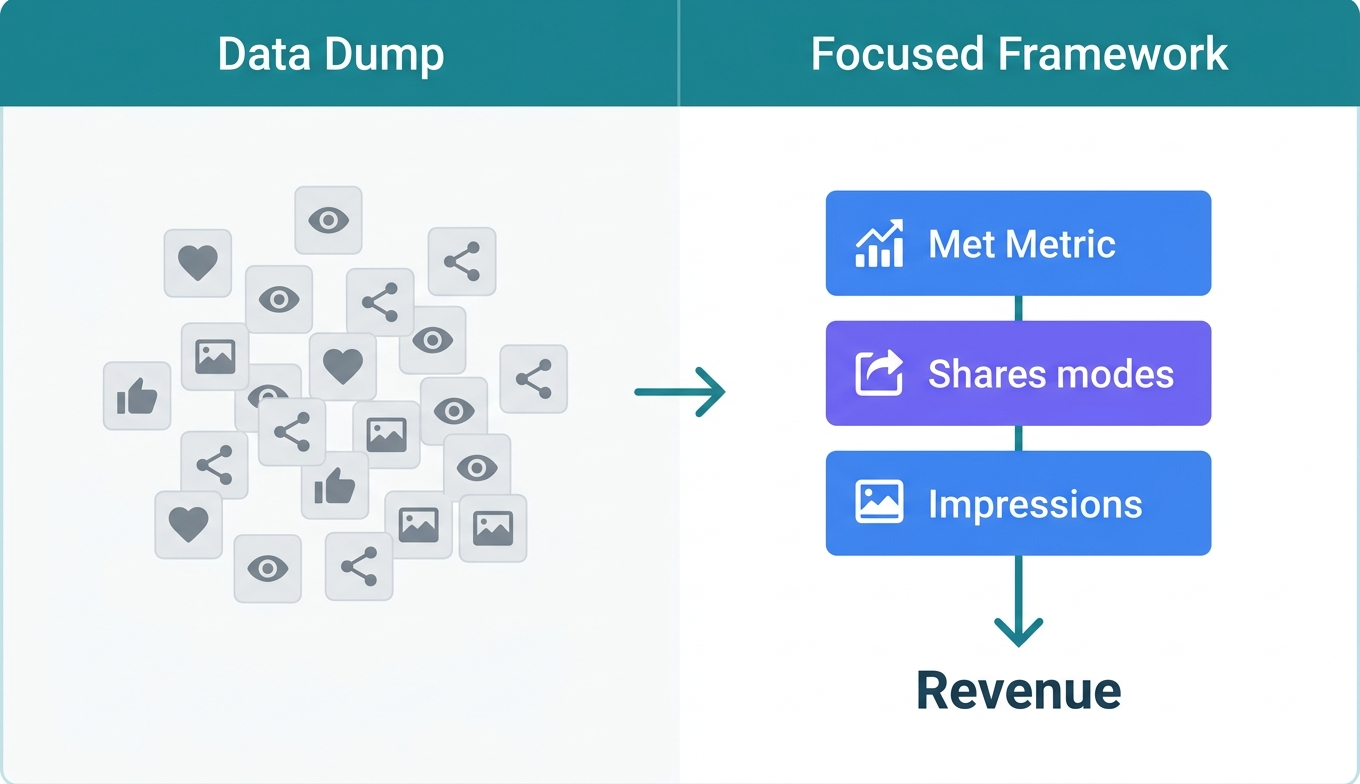
Mistake 2: Mixing metrics across channels. You can’t add paid search impression share to social media estimated impressions to CTV completed views and get a “total SOV.” These metrics have different scales, different denominators, and different meanings. Report channel-level SOV separately. If you need a blended view, weight each channel by its contribution to pipeline or revenue.

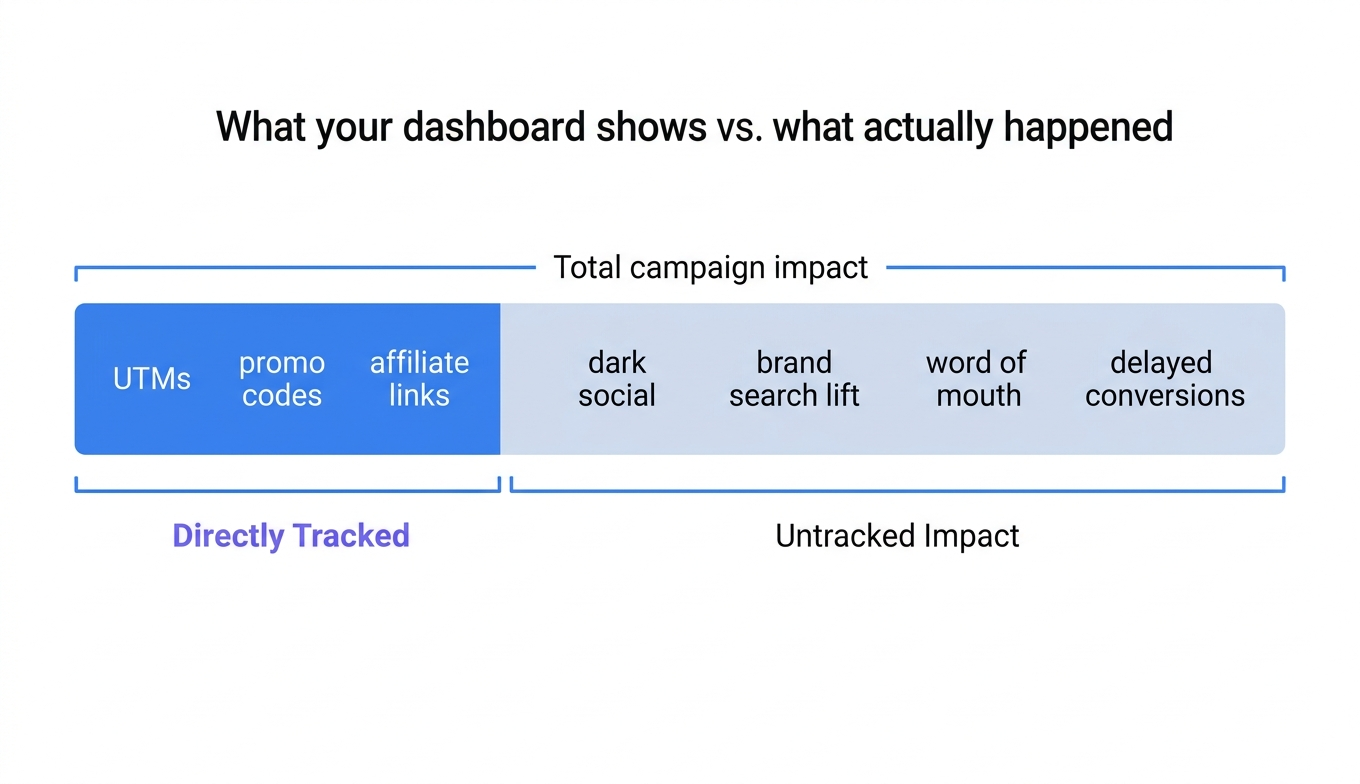
Mistake 3: Measuring only spend. Spend-based SOV tells you who’s buying more ads. Impression-based SOV tells you who’s being seen more. These can diverge dramatically based on targeting efficiency, ad quality, and inventory selection. A brand spending 30% less than a competitor can still have higher impression-based SOV if their media buying is sharper.

Mistake 4: Ignoring time windows. SOV fluctuates weekly. Measuring it once per quarter gives you an average that hides the periods when competitors surged past you during a product launch, seasonal campaign, or promotional push. Monthly measurement is the minimum. Weekly is better for high-competition categories.

How Advertising SOV Connects to Broader Brand Measurement

Advertising share of voice is one slice of a larger picture. Your brand’s total visibility includes organic search presence, social media conversation share, earned media coverage, and, increasingly, how often AI platforms mention your brand when users ask category-level questions.

The relationship between these layers matters. High advertising SOV with low organic SOV suggests you’re buying attention without earning trust. High organic SOV with low advertising SOV suggests you’re relying on existing authority without investing in growth. The most durable brands maintain strong share of voice across multiple layers simultaneously.

The gap between SOV and market share remains the single most useful diagnostic for brand health. When advertising SOV drops but market share holds steady, you’re living on borrowed time, existing customers are keeping revenue stable, but new customer acquisition is slowing. When advertising SOV rises and market share doesn’t follow, something in the funnel below awareness is broken.

The brands that measure both, and track the lag between them, make better allocation decisions than brands that optimize either metric in isolation.

Building an Advertising SOV Report That Drives Decisions

An SOV report that just shows percentages is a dashboard. A report that drives decisions connects SOV to business outcomes and competitive shifts.

advertising-sov-report-template-example
A useful SOV report shows channel-level competitive data alongside ESOV calculations, not a single blended number.

Here’s what belongs in a monthly advertising SOV report:

  1. Channel-level SOV, your brand vs. top 3, 5 competitors, per channel, with month-over-month trend
  2. ESOV calculation, advertising SOV minus current market share, showing whether you’re investing ahead or behind
  3. SOV by sub-category or keyword cluster, where you’re winning and losing at the product level, not just the brand level
  4. Cost efficiency metrics alongside SOV, are SOV gains coming from better efficiency or just higher spend?
  5. Competitive movement flags, highlight any competitor whose SOV jumped more than 5 points in a month, with a hypothesis on why

Skip vanity aggregations. Nobody needs a “total blended SOV” number. Channel-specific data with competitive context is what makes the report useful. If you need a template for structuring this kind of reporting, our guide to measuring share of voice covers the framework in detail.

Frequently Asked Questions

What is the difference between share of voice and impression share?

Impression share is a platform-specific metric, Google Ads tells you what percentage of eligible impressions your ads captured. Share of voice is a broader competitive metric that compares your brand’s total advertising visibility against all competitors in your category. Impression share feeds into SOV, but SOV includes channels beyond search, like social, CTV, and retail media. Think of impression share as one input; share of voice as the full picture.

How often should you measure advertising share of voice?

Monthly at minimum. Weekly if you’re in a high-competition category like insurance, fintech, or consumer electronics where competitors shift budgets rapidly. Quarterly measurement is too slow, by the time you spot a competitor’s surge, they’ve already captured mindshare you’ll spend months recovering.

Can a small brand compete on share of voice against bigger competitors?

Not across the entire market, and you shouldn’t try. Concentrate SOV measurement and spending on a narrow segment: one product subcategory, one geographic market, or one audience persona. A DTC skincare brand with a $200K monthly ad budget can’t touch L’Orรฉal’s national SOV. But it can dominate SOV for “clean retinol serum” on paid search and Instagram in three target metros. That focused dominance drives real growth.

Does higher advertising SOV guarantee market share growth?

No. It increases the probability of growth, but doesn’t guarantee it. The Binet and Field research found a tendency for excess SOV to correlate with market share gains, not a certainty. Product quality, pricing, distribution, and brand perception all mediate the relationship. A brand with 30% SOV and a terrible product will still lose share. SOV amplifies whatever your brand actually delivers.

What Comes After Measuring Advertising SOV

Knowing your share of voice number is the starting point, not the finish line. The real value comes from what you do with the data: reallocating budget toward channels where competitors are weak, improving ad quality to stretch existing budgets further, timing campaigns to exploit seasonal gaps, and tracking ESOV against market share over quarters to see whether your investment strategy is actually working.

If your advertising SOV tells you one story but your social media share of voice and brand awareness metrics tell a different one, that dissonance is the signal. It means your paid visibility isn’t translating into organic conversation, earned attention, or brand recall, and that’s a strategic problem worth solving before the next budget cycle.

The brands that win aren’t the ones that measure SOV once. They’re the ones that build it into monthly rhythm, channel by channel, competitor by competitor, and adjust faster than the market moves around them.

Social Media Monitoring Services That Drive Results

social-media-monitoring-service-layers-collection-analysis-action

Social Media Monitoring Services That Actually Protect Your Brand in 2026

Social media monitoring services track every mention of your brand, competitors, and industry keywords across social platforms, news sites, forums, and the broader web, then surface the conversations that demand your attention. The right service combines real-time alerting, sentiment analysis, and competitive benchmarking so you can respond to crises before they escalate, spot opportunities your competitors miss, and measure how your brand is perceived at scale.

But here’s the problem most marketing teams run into: the category is bloated. Dozens of tools promise “comprehensive monitoring” and “AI-powered insights.” Half of them just reheat the same Twitter firehose data and call it intelligence. The gap between what these services claim and what they deliver has never been wider, especially now that brand conversations are fragmenting across AI search results, private communities, and platforms that traditional monitoring tools barely cover.

This guide cuts through that noise. You’ll learn what separates a monitoring service that generates real strategic value from one that just generates dashboards nobody opens.

What You’ll Learn

  • What social media monitoring services actually include (and where the category falls short in 2026)
  • The five capabilities that separate high-value monitoring from expensive noise
  • How to evaluate providers based on your team size, budget, and goals
  • Where traditional monitoring misses the new brand conversations happening in AI search
  • A practical framework for building a monitoring program that drives action, not just alerts

What Social Media Monitoring Services Include

A social media monitoring service scans public conversations across platforms like X, Reddit, LinkedIn, Instagram, YouTube, TikTok, news outlets, blogs, and forums to find every instance where your brand, products, competitors, or industry topics are mentioned, then organizes that data into actionable reports.

Social Media Monitoring Services, social-media-monitoring-service-layers-collection-analysis-action
Most teams invest heavily in collection but underinvest in the layer that matters most, turning monitoring data into timely action.

That’s the baseline. Most providers in 2026 bundle some combination of these core functions:

  • Mention tracking, real-time detection of brand names, product names, campaign hashtags, and executive names across social and web sources
  • Sentiment analysis, automated classification of mentions as positive, negative, or neutral, sometimes with emotion-level detail
  • Competitive monitoring, tracking the same signals for your competitors to benchmark share of voice on social media
  • Alerting, notifications triggered by volume spikes, negative sentiment surges, or specific keyword appearances
  • Reporting and analytics, dashboards, trend visualizations, and exportable reports for stakeholders

Some services are self-serve platforms you operate internally. Others are fully managed, an agency team handles configuration, analysis, and delivers insights on a schedule. The managed approach costs more but removes the operational burden that causes most in-house monitoring programs to go stale within 90 days.

Why Monitoring Has Gotten Harder Since 2024

Two years ago, social media monitoring meant watching a handful of major platforms. That’s no longer sufficient. The fragmentation of brand conversations has accelerated faster than most monitoring tools have adapted.

Three shifts are driving this:

Conversations moved behind walls. Discord servers, Slack communities, WhatsApp groups, and private subreddits now host substantial brand discussion that no monitoring service can access through standard APIs. If your monitoring stack only covers public feeds, you’re seeing maybe 60% of the picture.

AI search is creating new brand exposure. When someone asks ChatGPT “what’s the best project management tool for agencies?” and your competitor gets named but you don’t, that’s a brand perception event your social monitoring dashboard will never capture. Tracking brand mentions in AI search results requires a completely different approach than tracking tweets.

Platform API access keeps tightening. X’s API pricing changes in 2023 rippled through the entire monitoring industry. Reddit followed with restrictions. TikTok’s data access remains limited for third-party tools. Each restriction shrinks the data pool your monitoring service draws from, often without telling you.

The result? A monitoring service that was thorough in 2023 might have significant blind spots today. Evaluating coverage depth, not just platform count, is now a critical part of vendor selection.

Five Capabilities That Separate Good Monitoring From Expensive Noise

Not all monitoring services deliver the same value at the same price point. After working across dozens of B2B campaigns, here are the capabilities that actually correlate with teams taking action on monitoring data, versus teams that check a dashboard once a month and forget about it.

Real-Time Alerting With Configurable Thresholds

Basic monitoring tells you someone mentioned your brand. Useful monitoring tells you when mention volume spikes 300% in two hours and sentiment has dropped sharply, before your CEO’s inbox fills up. The difference is configurable thresholds, not just keyword matching.

Look for services that let you set alerts on volume anomalies, sentiment shifts, and specific source types. A single negative review on a niche forum doesn’t need the same escalation path as a viral complaint thread on Reddit. Your alerting system should know the difference.

Sentiment Accuracy That Survives Sarcasm

Most sentiment engines still misclassify 15, 25% of mentions, according to MonkeyLearn’s analysis of sentiment model performance. Sarcasm, industry jargon, and context-dependent language trip up even well-trained models. “Great, another update that breaks everything” registers as positive in crude keyword-based systems.

Ask prospective vendors about their accuracy rates on your specific industry language. Better yet, run a test: feed them 50 real mentions from your brand and compare their automated classifications against your team’s manual assessment. The gap tells you exactly how much human review you’ll still need.

Source Depth Beyond the Big Platforms

If a service monitors X, Facebook, Instagram, YouTube, and LinkedIn, congratulations, that’s table stakes. The differentiator is coverage of Reddit, Quora, industry forums, product review sites, news aggregators, podcasts (via transcript), and niche community platforms where your buyers actually discuss solutions.

The pattern we see repeatedly in monitoring audits is that the most actionable brand intelligence almost never comes from mainstream social platforms. It surfaces on Reddit threads, G2 reviews, industry Slack channels, and comparison blog posts. Your brand monitoring service should cover those sources, or the dashboard quietly optimizes for vanity metrics.

Competitive Benchmarking That Goes Beyond Volume

Counting mentions is easy. Understanding whether your competitors are earning better mentions, more positive sentiment, higher-authority sources, stronger association with your category terms, requires structured competitive analysis.

The monitoring services worth paying for include share-of-voice tracking segmented by platform, sentiment, and topic. You should be able to answer: “Are we mentioned more often than Competitor X, and in what context?” not just “How many times was our name said this week?”

Reporting That Connects to Business Outcomes

Dashboards aren’t insights. A weekly report showing mention counts, sentiment ratios, and top sources is a starting point, not a deliverable. The services that generate real strategic value connect monitoring data to business questions: Is our product launch resonating with the right audience? Did the PR crisis affect purchase consideration? Where are we losing share of voice to competitors?

basic-vs-strategic-social-media-monitoring-comparison
The difference between basic and strategic monitoring isn’t the data, it’s whether the output connects to decisions your team actually makes.

If your current monitoring service can’t help you build a media monitoring report that drives action, it’s a cost center pretending to be a strategy tool.

How to Evaluate Social Media Monitoring Providers

Skip the feature comparison spreadsheets for a moment. Before you evaluate specific platforms or agencies, clarify three things about your own situation, because the right service depends entirely on context.

Match the Service Model to Your Team

Self-serve platforms (Brandwatch, Sprout Social, Mention, Hootsuite) work well when you’ve at least one person who will configure queries, review alerts, and interpret data weekly. That person doesn’t exist on most lean marketing teams. They intend to do it. Then Q3 hits and nobody’s logged in since onboarding.

Managed services, where an agency configures, monitors, and reports, cost more per month but produce more consistent output. If your team has fewer than three marketers, managed monitoring almost always delivers better ROI than a self-serve license nobody uses.

Define What “Coverage” Actually Means for Your Brand

A tool that monitors 30 platforms sounds impressive until you realize your audience primarily discusses your category on two: Reddit and a handful of niche forums. Ask vendors to show you real data from your industry vertical, not aggregate platform counts.

B2B SaaS brands, for example, need deep coverage of G2, Capterra, Reddit (especially r/SaaS, r/startups, and vertical subreddits), LinkedIn, and industry blogs. A monitoring service that’s strongest on Instagram and TikTok won’t move the needle.

Test Before You Commit

Most platforms offer free trials or demo periods. Use them strategically:

  1. Set up monitoring for your brand name, your top competitor, and one industry keyword
  2. Run the trial for 14 days without changing configuration
  3. Compare what the tool found against a manual search of the same terms on the same platforms
  4. Note what the tool missed, what it misclassified, and how many alerts were genuinely actionable

This 14-day test reveals more about a monitoring service than any sales demo ever will.

The Blind Spot Most Monitoring Services Won’t Mention

The monitoring mistake we see most often in social-listening audits is a team tuning alerts on mainstream platforms and ignoring review and peer-community surfaces until a crisis hits. Reddit and G2 threads shape buying decisions weeks before a Twitter post would, and AI retrievers already weight those surfaces heavily for category judgments. Budget a share of the monitoring program for those sources from day one.

Here’s the uncomfortable truth about social media monitoring in 2026: even the best traditional monitoring service misses an entire category of brand conversation, the one happening inside AI models.

social-media-monitoring-vs-ai-visibility-monitoring-blind-spot
Traditional monitoring covers what people say about you on social platforms, but misses what AI says about you when buyers ask for recommendations.

When a potential buyer asks ChatGPT, Gemini, or Perplexity to recommend a solution in your category, the AI either mentions your brand or it doesn’t. That recommendation, or omission, shapes perception before the buyer ever visits your website, reads a review, or sees your social posts.

Traditional social media monitoring tools don’t track this. They’re built for indexed, public, real-time social content. AI-generated responses operate on a different data layer entirely, one informed by training data, citation patterns, and entity authority built over months or years.

This isn’t a reason to abandon social monitoring. It’s a reason to recognize its limits. Social monitoring tells you what people are saying about your brand on public platforms right now. AI brand mention tracking tells you what AI models are saying about your brand when potential customers ask. You need both.

At BrandMentions, we’ve tracked AI citation patterns across ChatGPT, Gemini, and Perplexity for B2B companies in over 40 categories. The brands that appear in AI recommendations share a common trait: they’ve built entity authority through consistent mentions on high-authority publications that AI models learn from. Social media buzz alone doesn’t drive AI visibility, editorial presence does.

Building a Monitoring Program That Drives Action

Tools and services are only as good as the system you build around them. Most monitoring programs fail not because the data is bad, but because nobody owns the response process. Alerts fire, dashboards update, and nothing happens.

Fix that with a three-part structure.

Assign Ownership by Response Type

Not every mention needs the same team. Map your monitoring categories to specific owners:

Mention Type Owner Response Window
Customer complaint (public) Customer success / support Under 2 hours
Product bug report Product team via support Under 4 hours
Positive review or testimonial Marketing Within 24 hours
Competitor comparison mention Product marketing Within 48 hours
Crisis / viral negative thread Communications lead Under 1 hour
Industry trend discussion Content team Weekly review

Without this mapping, monitoring becomes a spectator sport. Everyone sees the data. Nobody acts.

Set Review Cadences That Match Reality

Daily alert reviews work for high-volume consumer brands. Most B2B teams get more value from a weekly focused review of the past seven days, identifying patterns, not chasing individual mentions.

Monthly reporting should synthesize trends for leadership: share of voice shifts, sentiment trajectory, competitive positioning changes, and emerging topics. Keep it to one page. Executives don’t need 47-slide monitoring decks.

Connect Monitoring Insights to Content and Strategy

The highest-value output of a monitoring program isn’t crisis avoidance, it’s strategic intelligence. When monitoring data consistently shows your audience asking the same question your content doesn’t answer, that’s a content brief. When competitors keep getting mentioned in a context where your brand is absent, that’s a positioning gap.

social-media-monitoring-program-alert-review-action-flow
The programs that work don’t just collect alerts, they connect every alert to a review step and a clear action owner.

Feed monitoring insights into your content calendar, your brand sentiment analysis workflow, and your competitive strategy reviews. Monitoring that stays siloed in a dashboard adds cost. Monitoring that informs decisions adds value.

What to Expect From Pricing in 2026

Monitoring service pricing varies wildly depending on model type, coverage depth, and whether humans are involved in analysis. Here’s a realistic breakdown:

Self-serve platforms range from free (limited features, limited sources) to $300, $1,500/month for mid-market plans. Enterprise tiers from Brandwatch, Sprout Social, or Meltwater can run $3,000, $10,000+ monthly. You’re paying for data access, user seats, and platform capabilities, the analysis is your responsibility.

Managed monitoring services typically start around $2,000, $5,000/month for ongoing monitoring, alerting, and regular reporting. Higher-touch packages that include strategic recommendations, crisis response protocols, and competitive intelligence reports can reach $8,000, $15,000/month. You’re paying for human expertise and time, not just software.

The “free” options, Google Alerts, basic social listening tiers, native platform notifications, work for solopreneurs and very early-stage startups. They don’t scale, they miss most non-major-platform mentions, and they provide zero competitive context. Worth starting with. Not worth staying with.

If you’re spending over $1,000/month on monitoring and can’t point to three specific decisions it informed last quarter, that’s a sign the service isn’t the problem, the program around it’s. (Go back to the ownership mapping above.)

How Social Media Monitoring Feeds AI Visibility Strategy

For the per-platform walkthroughs behind the AI side of that connection, see checking brand mentions in ChatGPT and how Perplexity surfaces brands, and tracking your brand across LLMs covers the cross-platform cadence that pairs with the social-monitoring program described below.

This is the connection most brands haven’t made yet.

Social media monitoring data tells you which topics your audience cares about, which competitors dominate the conversation, and where your brand perception is strongest or weakest. That same intelligence should inform what you publish, where you publish it, and how you build entity authority for AI search.

Think about it practically. If monitoring shows your brand consistently gets mentioned alongside “affordable” but never alongside “enterprise-grade,” and you’re trying to move upmarket, that’s not just a social media problem. It’s a positioning problem that will follow you into AI recommendations. LLMs learn brand-category associations from the web content they train on. If every mention of your brand pairs it with “affordable,” AI models will recommend you for budget buyers and ignore you for enterprise queries.

The fix isn’t more social media posts. It’s strategic placement of brand mentions in high-authority editorial content that associates your brand with the positioning you want. Social monitoring identifies the gap. Strategic brand mention placement closes it.

Social media monitoring services identify how your brand is perceived today across public platforms. AI visibility strategy determines how your brand will be recommended tomorrow by ChatGPT, Gemini, and Perplexity.

Teams comparing in-house and agency models often start with a tool review. Our breakdown of Mention.com social listening covers what a standalone tool gives you before you commit to an agency relationship.

Frequently Asked Questions

What is a social media monitoring service?

A social media monitoring service tracks mentions of your brand, competitors, and industry keywords across social platforms, news sites, forums, and the web. It collects mention data, analyzes sentiment, detects trends, and delivers alerts or reports so your team can respond to conversations, protect your reputation, and benchmark against competitors. Services range from self-serve software platforms to fully managed agency offerings where analysts handle configuration, monitoring, and insight delivery on your behalf.

How much do social media monitoring services cost?

Self-serve platforms range from free to $10,000+/month depending on features and scale. Mid-market plans from tools like Mention, Hootsuite, or Sprout Social typically cost $300, $1,500/month. Managed monitoring services, where a team handles the work, start around $2,000/month and go up based on scope, reporting frequency, and the level of strategic analysis included.

What’s the difference between social media monitoring and social listening?

Monitoring focuses on tracking specific mentions and responding to them, it’s reactive and operational. Listening is broader: it analyzes conversation patterns, audience sentiment trends, and competitive positioning over time to inform strategy. In practice, most modern services blend both. If a vendor only offers mention alerts without trend analysis, they’re selling monitoring. If they help you understand why sentiment shifted and what to do about it, that’s listening. Most brands need the combination.

Can social media monitoring tools track AI search mentions?

No. Traditional social media monitoring services are built to track public conversations on indexed web and social platforms. They don’t monitor what AI models like ChatGPT, Gemini, or Perplexity say about your brand in response to user queries. Tracking AI-generated brand mentions requires specialized tools and approaches, a different discipline from social monitoring. Imagine a startup founder asking Perplexity “best CRM for early-stage SaaS” and your competitor getting cited. Your social monitoring dashboard would never flag that. AI visibility tracking would.

How often should my team review monitoring data?

It depends on mention volume and risk tolerance. High-volume consumer brands should review alerts daily. Most B2B companies get the best results from a weekly focused review with a monthly strategic summary for leadership. The key isn’t frequency, it’s having a clear owner for each mention type and a defined response process. Weekly review with clear ownership beats daily review that nobody acts on.

A 30-Day Monitoring Program to Run This Quarter

Social media monitoring services remain a foundational marketing capability. But “foundational” doesn’t mean “sufficient.” The brands that will lead their categories by the end of 2026 aren’t just listening to public conversations on social platforms, they’re monitoring how AI models represent them, building entity authority across the editorial sources those models learn from, and using social monitoring intelligence to inform that broader strategy.

If your current monitoring setup feels like it’s generating noise instead of signal, the problem is probably structural, not technical. Fix the ownership. Narrow the scope. Connect insights to decisions. And expand your definition of “monitoring” to include the AI search layer where your next customers are already forming opinions.

If you want a baseline before committing to a tool or process, request a quick AI visibility audit. We’ll run 25 category-relevant prompts across ChatGPT, Perplexity, Gemini, and Google AI Overviews so you can see exactly which sources each platform trusts for your category, and which competitors are capturing citations you’re not.

Written by the BrandMentions editorial team. AI-assisted drafting with human editorial review and oversight.

[
,

]

How to Measure Share of Voice Across Every Channel

share-of-voice-formula-applied-across-social-seo-pr-channels

How to Measure Share of Voice Across Every Channel

Share of voice tells you how much of the conversation in your market belongs to your brand versus your competitors. To measure it, divide your brand’s metric (mentions, impressions, ad spend, or keyword visibility) by the total market metric across all tracked competitors, then multiply by 100. That gives you a percentage, your share of the category’s total visibility on any given channel.

The formula hasn’t changed much in decades. What has changed is where you need to apply it. In 2026, share of voice isn’t just a media buying metric or a social listening stat. It extends to organic search, AI-generated answers, influencer content, and LLM citations. Brands that only track one channel get a distorted picture, and distorted pictures lead to bad budget decisions.

This guide breaks down the exact methods for measuring share of voice on every channel that matters right now, including the ones most guides still ignore.

What You’ll Learn

  • The core share of voice formula and how to adapt it per channel
  • Channel-specific measurement methods for social, SEO, PPC, PR, and AI search
  • How to choose the right competitive set and time window
  • Where most brands get SOV measurement wrong, and how to fix it
  • Tools that actually work for each channel in 2026

The Share of Voice Formula (And Why One Formula Isn’t Enough)

Share of voice equals your brand’s measured presence divided by the total measured presence across all competitors, multiplied by 100. The result is a percentage that shows your slice of the category conversation.

How To Measure Share Of Voice, share-of-voice-formula-applied-across-social-seo-pr-channels
Same formula, different inputs. The channel you’re measuring determines what SOV actually tells you.

Written out:

SOV (%) = (Your Brand’s Metric รท Total Market Metric) ร— 100

If your brand earned 3,200 social mentions last month and all tracked competitors combined (including you) earned 28,000 mentions, your social share of voice is 11.4%.

Simple enough. But here’s where most measurement falls apart: the formula changes meaning depending on which metric you feed into it. Social mentions, organic keyword visibility, paid impression share, and media coverage volume all use the same math, yet they measure fundamentally different things. Lumping them together into a single “SOV number” creates the illusion of insight without the substance.

Treat each channel as its own measurement. Then look at the pattern across channels to spot where you’re strong, where you’re weak, and where your competitors are eating your visibility.

How to Measure Social Media Share of Voice

Social SOV measures how much of the public conversation about your category features your brand. It’s the most accessible form of share of voice because the data is abundant and tools have matured to handle it well.

What to measure: brand mentions (tagged and untagged), branded hashtag usage, @mentions, and comment volume where your brand is the topic. Some teams also include share of engagement, likes, shares, and comments on brand content versus competitor content, though this tells you more about content quality than visibility.

Step-by-step method:

  1. Define your competitive set. Pick 4, 6 direct competitors. More than that dilutes the signal.
  2. Choose a consistent time window. Monthly is standard. Weekly if you’re running a campaign and need faster feedback.
  3. Track mentions across platforms, X, LinkedIn, Instagram, TikTok, Reddit, and relevant forums. Don’t limit to one platform unless your audience genuinely lives there exclusively.
  4. Sum total mentions for all brands in your set (including yours).
  5. Divide your mentions by the total. Multiply by 100.

What most brands miss: untagged mentions. Someone writing “just switched from Salesforce to HubSpot” on LinkedIn doesn’t tag either brand. Social listening tools like Brandwatch and Sprout Social catch these. Google Alerts won’t. If you’re only tracking @mentions and hashtags, you’re undercounting by 30, 50% in most B2B categories.

Also worth noting, a high mention count with predominantly negative sentiment isn’t a win. Pair social SOV with measuring brand sentiment to understand whether your share of conversation is actually working for you.

How to Measure SEO Share of Voice

SEO share of voice quantifies your organic search visibility relative to competitors across a defined set of keywords. It’s one of the strongest leading indicators of organic traffic potential because it captures both ranking position and search volume in a single metric.

SEO share of voice is calculated by estimating the organic click-through rate for each keyword you rank for, multiplied by that keyword’s monthly search volume, then dividing your total estimated clicks by the total estimated clicks available across all tracked keywords and competitors.

Most SEO professionals don’t calculate this manually. Tools like Ahrefs, Semrush, and Sistrix calculate SEO visibility scores that function as SOV proxies. Ahrefs calls theirs “Share of Voice” directly, it estimates organic traffic share across a keyword list you define.

The method that actually works:

  1. Build a keyword list that represents your category. Not just your keywords, the full set of terms a buyer might search when considering a solution in your space. Include branded and unbranded terms.
  2. Add your competitors to the same tracking project.
  3. Let the tool calculate visibility share based on ranking positions and estimated CTR curves.
  4. Review monthly. Look for trends, not snapshots.

The keyword list is where this measurement lives or dies. Track too few keywords and a single ranking change swings your SOV by 10 points. Track too many generic terms and you dilute the metric with keywords your buyers don’t actually search. For a B2B SaaS company, 80, 150 high-intent keywords usually gives a stable, meaningful picture.

One blind spot in pure SEO SOV: it doesn’t account for SERP feature ownership. If a competitor holds the Featured Snippet for your most valuable keyword, their actual visibility is much higher than their organic ranking position suggests. Factor SERP feature presence into your analysis whenever possible.

How to Measure PPC Share of Voice

Google Ads already does most of this work for you. Your impression share, the percentage of available impressions your ads captured, is effectively your paid share of voice for a given keyword set.

Find it in Google Ads under Campaigns to Columns to Competitive Metrics to Search Impression Share. You’ll also see “Search Lost IS (Budget)” and “Search Lost IS (Rank),” which tell you whether you’re losing visibility because of spend limits or ad quality.

For a broader PPC SOV that includes competitors, tools like SpyFu and Auction Insights (built into Google Ads) reveal how often you and specific competitors show for the same queries, and how your overlap, position, and outranking rates compare.

PPC share of voice is the easiest to manipulate, you can buy more of it tomorrow by increasing your budget. That’s also why it’s the least durable form of SOV. The moment you stop spending, it drops to zero. Think of it as a visibility accelerator, not a foundation.

How to Measure PR and Media Share of Voice

Media SOV measures how much press coverage your brand earns compared to competitors. This was the original share of voice metric, born in advertising, refined in PR, and it still matters for brands that invest in earned media.

What counts: news articles, industry publications, podcast mentions, analyst coverage, and broadcast segments. Depending on your category, you might also include conference presentations and guest columns.

The challenge here is data collection. Social mentions are relatively easy to scrape. Media coverage requires either a media monitoring service (Meltwater, Cision, or Muck Rack) or a manual tracking process.

A practical approach for teams without enterprise tools:

  • Set up Google News Alerts for your brand and each competitor.
  • Log every piece of coverage in a shared spreadsheet: date, publication, brand mentioned, article topic.
  • At month’s end, count coverage per brand and calculate share.

Crude? Yes. But it catches the broad strokes. When you’re ready for deeper analysis, media monitoring platforms can layer in reach estimates, publication authority scores, and sentiment, all of which add nuance to a raw mention count.

share-of-voice-raw-count-vs-reach-weighted-comparison
Fewer mentions can mean more visibility when you weight by publication reach. Raw counts alone hide the real story.

One opinion I’ll stand behind: raw coverage count is an almost useless metric on its own. A mention in the Wall Street Journal and a mention in a regional blog with 200 monthly visitors aren’t equivalent. If you’re measuring media SOV, weight by publication reach or domain authority. Otherwise, you’re optimizing for volume instead of impact.

For the per-platform walkthroughs behind the AI-search slice of SOV, see the ChatGPT brand mention check workflow and Perplexity brand monitoring, and how AI models cite brands covers the cross-platform cadence the AI-side measurement described below should run on.

This is the channel most guides still skip entirely. And it’s the one growing fastest.

When a buyer asks ChatGPT, Perplexity, or Gemini for a recommendation in your category, the brands that get mentioned in the response have share of voice in AI search. The brands that don’t get mentioned have zero, regardless of how strong their Google rankings are.

Measuring AI share of voice is harder than any traditional channel because AI responses aren’t indexed, aren’t static, and change based on how the question is phrased. But it’s not impossible.

Method 1: Manual prompt auditing. Build a list of 20, 30 category-relevant prompts your buyers might ask an AI assistant. (“What’s the best project management tool for remote teams?” / “Compare Notion and Monday.com for enterprise use.”) Run each prompt across ChatGPT, Perplexity, and Gemini. Log which brands appear in each response. Calculate your mention frequency versus competitors.

Method 2: AI visibility tracking tools. A growing category of tools now automates this process. They run prompt libraries at regular intervals and track which brands get cited in AI-generated answers over time. The pattern we see in AI citation audits is that brands appearing in category-relevant editorial content are materially more likely to be recommended in LLM responses than brands leaning on their own website content alone.

AI share of voice matters because it shapes first impressions before a buyer ever reaches your website. If ChatGPT recommends three competitors and doesn’t mention you, you’re not even in the consideration set, and you may never know it happened.

Choosing Your Competitive Set and Time Window

Your SOV measurement is only as useful as your inputs. Pick the wrong competitors or the wrong timeframe and the number means nothing.

Competitive set: 4, 6 direct competitors is the sweet spot. Fewer than 4 and a single competitor’s spike distorts your share. More than 8 and the metric gets diluted, everyone has a small slice and movement is hard to spot. Include the brands your sales team actually loses deals to, not every company in your general industry.

Resist the urge to include aspirational competitors you don’t actually compete with for buyers. If you’re a Series B SaaS company, measuring your SOV against Salesforce tells you nothing actionable. Measure against the 5 companies your prospects are comparing you to on G2 and in demo calls.

Time window: Monthly measurement gives stable trends. Weekly is useful during campaigns or product launches. Quarterly is too slow, by the time you see a drop, you’ve already lost ground for three months.

Compare the same time period year-over-year, not just month-over-month. SOV in many categories is seasonal. A dip in December might be completely normal for your industry.

Where Most SOV Measurement Goes Wrong

The SOV mistake we see most often in competitive audits is a team benchmarking against the wrong peer set: loud incumbents that show up for brand queries that nobody is actually evaluating against them. The category-defining comparison is usually the two or three companies a prospect names in the sales call, not the three biggest logos in the industry. Re-run the math against that narrower set and the headline number almost always changes.

After reviewing how dozens of marketing teams track share of voice, a few mistakes come up over and over.

Mistake 1: Treating all mentions as equal. A mention on TechCrunch and a mention in a spam blog aren’t the same thing. If your measurement doesn’t weight for source quality, reach, or sentiment, a competitor could be “winning” SOV with coverage that actively hurts their brand. Quality weighting isn’t optional, it’s the difference between a vanity metric and a useful one.

Mistake 2: Measuring one channel and calling it SOV. Social listening tools make it easy to track social SOV, so teams stop there. But your buyers don’t live on one channel. A full media monitoring report covers social, search, media, and increasingly, AI surfaces. Cross-channel measurement reveals where competitors are investing, and where they’re leaving gaps for you.

Mistake 3: No competitive context. Your SOV dropped from 18% to 14%. Is that bad? It depends. Did the total conversation shrink (your absolute mentions may be unchanged)? Did a new competitor enter the market and take share from everyone? Without context, a number is just a number.

excess-share-of-voice-vs-market-share-growth-signal
When your share of voice consistently exceeds your market share, growth tends to follow. The size of the gap matters more than the absolute number.

Mistake 4: Ignoring the gap between SOV and market share. Research by Les Binet and Peter Field across 171 campaigns found that brands with an excess share of voice (SOV exceeding their market share) tend to grow, while brands with a deficit tend to shrink. That gap, not the absolute SOV number, is the metric that predicts growth.

Which Tools to Use for Each Channel

You don’t need one tool that does everything. You need the right tool for each channel you’re measuring.

Channel Recommended Tools What They Measure
Social media Brandwatch, Sprout Social, Hootsuite Mentions, hashtags, engagement share, sentiment
SEO / organic search Ahrefs, Semrush, Sistrix Keyword visibility, estimated traffic share, SERP feature ownership
PPC / paid search Google Ads (Auction Insights), SpyFu Impression share, overlap rate, outranking share
PR / media Meltwater, Cision, Muck Rack, Google News Alerts Coverage volume, publication reach, sentiment, message pull-through
AI search AI visibility analytics platforms, manual prompt auditing Brand citation frequency in LLM responses, recommendation position

Budget-conscious teams can start with Google Ads impression share (free within your Google Ads account), Google News Alerts (free), and manual AI prompt auditing (free but time-intensive). Layer in paid tools as your measurement practice matures.

Building a Share of Voice Report That Drives Decisions

A SOV dashboard that sits in a spreadsheet and gets glanced at once a month doesn’t change behavior. The report needs to answer three questions every time someone opens it:

share-of-voice-reporting-cycle-measure-compare-act
A useful SOV report doesn’t just show numbers, it connects measurement to competitive context to action.
  1. Where are we gaining? Which channels saw SOV increase? What drove it, your activity or a competitor going quiet?
  2. Where are we losing? Which channels showed decline? Is a specific competitor taking share, or is the total conversation growing while your absolute presence stays flat?
  3. What should we do next? Tie every SOV movement to a recommended action. SOV down on social? Audit content cadence and topic relevance. SOV down in AI search? Review where your brand appears in editorial sources LLMs pull from.

Include a month-over-month trend line for each channel, a competitor comparison table, and a “biggest movers” callout that highlights the most significant shifts. Keep it to one page. Executives won’t read more than that, and they shouldn’t have to.

Frequently Asked Questions

What is a good share of voice percentage?

There’s no universal benchmark, it depends entirely on your market concentration and competitive set. In a fragmented category with 20+ competitors, 8, 12% might be strong. In a category with 4 dominant players, anything below 20% could signal you’re underweight. The more useful question: is your SOV higher than your current market share? If yes, you’re positioned for growth.

How often should you measure share of voice?

Monthly is the standard cadence for most brands. It’s frequent enough to catch shifts early but long enough to smooth out daily noise. During active campaigns or product launches, switch to weekly. Quarterly is too slow, competitive dynamics move faster than that in most categories.

Can you measure share of voice without paid tools?

Yes, but with limitations. Google Ads impression share is free within your account. Google News Alerts gives you basic media coverage tracking. For social, you can manually search brand mentions on each platform. AI search SOV can be measured by running prompts yourself. It’s labor-intensive, but a startup with zero budget can still get a directional picture of where they stand. Paid tools add speed, accuracy, and historical trending, they’re worth it once measurement becomes a regular practice.

What’s the difference between share of voice and share of market?

Share of voice measures visibility, how much of the conversation or advertising space your brand occupies. Share of market measures revenue, how much of total category sales you capture. SOV is a leading indicator. Market share is a lagging one. Think of it this way: imagine a brand that suddenly doubles its media presence but hasn’t changed its sales numbers yet. Its SOV has jumped while its market share stays flat. If the pattern holds, market share growth typically follows within 6, 12 months.

Does share of voice in AI search actually matter?

It matters more every quarter. When a buyer asks ChatGPT or Perplexity to recommend a solution in your category, the brands that appear in the answer are the ones that enter the consideration set. If your competitors are consistently cited and you’re not, you’re losing deals before they even become deals, at a stage you can’t track in your CRM. Measuring and building brand visibility in AI search is becoming as important as measuring organic search visibility.

Using Share-of-Voice Data to Drive the Next Quarter’s Plan

Measuring share of voice is step one. The real value comes from what you do with the data, and most teams stop too early. They measure, they report, and then the number sits in a slide deck until next month.

Tie every SOV insight to a specific action. If your social SOV dropped because a competitor launched a viral campaign, don’t just note it, decide whether to respond with your own content push or invest in a different channel where they’re weaker. If your AI search SOV is near zero while competitors are getting cited regularly, that’s a signal to invest in the editorial presence that LLMs actually learn from.

The brands that grow their share of voice consistently are the ones that treat it as an operational metric, not a reporting metric. Measure it. Compare it. Act on it. Repeat monthly.

If you want a baseline before committing to a tool or process, request a quick AI visibility audit. We’ll run 25 category-relevant prompts across ChatGPT, Perplexity, Gemini, and Google AI Overviews so you can see exactly which sources each platform trusts for your category, and which competitors are capturing citations you’re not.

Written by the BrandMentions editorial team. AI-assisted draft, human-edited and reviewed for accuracy.

Frequently Asked Questions

How do I measure share of voice across multiple regions or countries?

Regional share of voice measurement requires either a multi-country brand monitoring tool (Brand24, Brandwatch, Talkwalker support 30+ regions) or running separate tracked queries per region with a tool that filters by geography. The formula stays the same: your mentions divided by total category mentions in that region, expressed as a percentage. The tricky part is normalizing for population and search volume differences. A 10 percent share of voice in Brazil and 10 percent in Germany don’t represent equal opportunity. Adjust for category search volume per region before comparing.

[
,

]

Influencer Marketing KPIs That Prove Real ROI

influencer-kpi-data-dump-versus-focused-framework

Most brands track the wrong influencer marketing KPIs. They screenshot likes, celebrate follower spikes, and report engagement rates that never connect to a single dollar of revenue. Then the CFO asks, “What did we get for that $50K?”, and the room goes quiet.

Influencer marketing KPIs are the specific metrics you use to measure whether an influencer campaign delivered against its objective, whether that’s awareness, traffic, conversions, or long-term brand equity. The right KPIs change based on what you’re trying to achieve. A brand awareness campaign measured by cost per acquisition will always look like a failure. A conversion campaign measured by reach will always look like a success, until someone checks the P&L.

The fix isn’t tracking more metrics. It’s choosing fewer, sharper ones that map directly to business outcomes. This piece breaks down exactly which KPIs to track by campaign goal, how to set benchmarks that aren’t fiction, and where attribution breaks down in ways most guides never mention.

Key Takeaways

  • Pick 2, 3 primary KPIs per campaign based on your funnel stage, not a generic checklist of 20 metrics.
  • Cost per acquisition (CPA), return on ad spend (ROAS), and customer lifetime value (LTV) are the KPIs that justify budgets to leadership.
  • Engagement rate alone is misleading without context, platform, influencer tier, and content format all shift what “good” looks like.
  • Attribution is the hard part. UTMs and promo codes cover the basics, but they miss the 60, 70% of conversions that happen outside the click path.
  • Brand mentions and share of voice are the KPIs most teams ignore, and they’re the ones that compound over time, especially in AI search.

Why Most Influencer KPI Frameworks Fail

The standard advice is to track everything: reach, impressions, engagement rate, click-through rate, conversions, EMV, sentiment, saves, shares, video completion rate, and audience growth. That’s not a measurement framework. That’s a data dump.

Influencer Marketing Kpis, influencer-kpi-data-dump-versus-focused-framework
The difference between a dashboard that justifies spend and one that drives decisions comes down to how many KPIs you treat as primary.

The problem is structural. When you track 15 KPIs, you’ll always find one that looks good. That makes it easy to justify the campaign internally, and impossible to actually learn what worked. Teams end up optimizing for metrics that flatter the report rather than metrics that grow the business.

A better approach: start with the business outcome you need, then work backward to the 2, 3 metrics that directly indicate whether you’re getting there. Everything else is context. Useful, maybe. Primary KPI? No.

Matching KPIs to Campaign Goals

An influencer campaign without a defined goal isn’t a campaign, it’s sponsorship. The goal dictates the KPIs. Not the other way around.

Here’s how the mapping works across four common objectives:

Campaign Goal Primary KPIs Supporting Metrics
Brand Awareness Reach, brand mentions, share of voice Impressions, video view completion rate, hashtag volume
Engagement Engagement rate (by reach), saves, shares Comment sentiment, story interactions, content saves
Traffic & Leads Click-through rate (CTR), cost per click (CPC), lead volume Landing page bounce rate, time on site, email sign-ups
Revenue & Conversions CPA, ROAS, conversion rate Promo code redemptions, average order value (AOV), LTV

Notice what’s missing from the primary column: follower count. Impressions. Likes. These aren’t bad data points, they’re just not decision-driving ones. They belong in the “context” layer, not the “did this work?” layer.

Awareness Campaigns

Your primary KPI is reach, the number of unique people who saw the content. Not impressions (which count repeat views), not follower count (which counts people who might see it). Reach tells you how many new eyeballs actually landed on your brand.

But reach alone is shallow. Pair it with brand mentions and share of voice to measure whether the campaign generated conversation beyond the influencer’s own post. Did people start talking about you? Did media pick it up? Did the brand name start appearing in organic discussions?

Share of voice measures the percentage of total brand-related conversations in your category that mention your brand, and it’s one of the strongest predictors of future market share growth. If your influencer campaigns aren’t moving share of voice, they’re generating attention without building position.

In campaigns we’ve tracked across B2B and DTC brands, the ones that invested in awareness KPIs alongside share of voice tracking on social media were far better at connecting influencer spend to pipeline growth three to six months downstream.

Conversion Campaigns

If the goal is revenue, your primary KPI is CPA or ROAS. Full stop.

CPA tells you what you paid to acquire each customer through the campaign. ROAS tells you how much revenue you generated per dollar spent. Together, they answer the only question leadership cares about: was this profitable?

Supporting metrics matter here too. Conversion rate tells you whether the influencer drove the right traffic (high intent) or just high volume. AOV tells you whether those customers spent more or less than your average. And promo code redemption rate gives you a clean, directly attributable signal, no UTM guesswork required.

One thing most guides skip: promo codes undercount. According to impact.com’s 2026 influencer benchmark data, roughly 32% of consumers who buy after seeing a sponsored post don’t use the code. They search the brand name directly, visit the site later, or buy in-store. Your promo code data captures the floor of performance, not the ceiling.

The KPIs That Actually Justify Budgets

Engagement rates don’t get budgets approved. Revenue metrics do. If you want influencer marketing to grow inside your organization, you need to speak the language your CFO already uses.

Cost Per Acquisition (CPA)

CPA = total campaign cost รท number of conversions attributed to the campaign. Simple formula, complicated reality.

The “complicated” part is attribution. A customer who sees an influencer’s TikTok, Googles your brand two days later, clicks a retargeting ad, and then converts, who gets credit? Last-click attribution gives it to the retargeting ad. The influencer, who created the initial demand, gets nothing.

This is why influencer CPA almost always looks worse than it actually is. The channel creates demand. Other channels capture it. If you measure influencer CPA in a silo, you’ll undervalue it every time.

Return on Ad Spend (ROAS)

ROAS = revenue from campaign รท campaign cost. A ROAS of 5:1 means you earned $5 for every $1 spent.

The Influencer Marketing Hub 2026 benchmark report found that the average influencer marketing ROI sits at $5.78 per $1 spent, with top-performing campaigns reaching $18, $20 per $1. But those top-tier results typically come from campaigns with strong attribution systems, not just better influencers.

If your ROAS calculation only counts promo code sales, you’re reporting maybe 30, 40% of real impact. Layer in post-purchase surveys (“How did you hear about us?”) and branded search lift to get closer to reality.

Customer Lifetime Value (LTV)

This is the metric most influencer measurement guides ignore, and it’s the one that changes the entire calculation.

An influencer-acquired customer with a $200 first order but $1,200 LTV is worth six times more than what your CPA calculation suggests. If influencer-sourced customers have meaningfully higher LTV than paid-social-sourced customers (and multiple DTC brands have reported exactly that), the true ROI of influencer marketing is being systematically underreported.

influencer-cpa-versus-lifetime-value-comparison
Most brands kill influencer programs based on first-purchase CPA, before the real value even shows up.

Track LTV by acquisition channel. It takes 6, 12 months of data to get reliable numbers, but it’s the single strongest argument you can bring to a budget conversation.

Engagement Rate: Useful, but Only With Context

Engagement rate is the metric everyone defaults to. And it can be useful, when you know what you’re comparing.

The formula most platforms use: (likes + comments + shares) รท total followers ร— 100. The problem is this formula rewards small audiences. A nano-influencer with 3,000 followers and 300 engagements has a 10% engagement rate. A macro-influencer with 500,000 followers and 10,000 engagements has a 2% rate, but drove 33x more total engagement.

Which one performed better? Depends entirely on your goal.

If you’re running a conversion campaign, you want total engagement volume from a targeted audience. If you’re testing creative concepts, you want engagement rate from a niche community. The number alone tells you almost nothing without the context of platform, influencer tier, content format, and campaign objective.

A few benchmarks worth knowing: TikTok nano-influencer engagement rates average around 10%, while Instagram nano-influencers sit closer to 1.7%. Comparing across platforms without adjusting for these baselines will lead you to bad decisions fast.

Saves and Shares Over Likes

If you’re going to track engagement, weight saves and shares higher than likes. A like takes half a second. A save means “I want to come back to this.” A share means “This is worth my social capital to recommend.” These are the engagement signals that correlate with purchase intent, and the ones most reporting dashboards bury.

Brand Mentions and Share of Voice: The Compounding KPIs

For the per-platform walkthroughs that make the mentions KPI measurable, see verifying ChatGPT cites your brand and running a Perplexity brand check, and monitoring how LLMs reference your brand covers the cross-platform cadence that pairs with the KPI framework described below.

Here’s where most influencer KPI guides stop too early. They cover reach, engagement, and conversions, the metrics you can measure in the first 72 hours. But influencer marketing also produces long-tail effects that compound over weeks and months.

Brand mentions, every instance where your brand name appears in earned content, comments, reviews, forums, or media coverage, are the residue of a good influencer campaign. They persist after the sponsored post drops out of the feed. And they influence surfaces that most marketers aren’t even measuring yet.

In AI search specifically, brand mentions across high-authority publications influence whether AI models like ChatGPT, Gemini, and Perplexity recommend your brand in response to category queries. An influencer campaign that generates editorial pickups and third-party mentions is building brand citations that AI models learn from, whether or not that was the original intent.

The pattern we see in influencer-KPI audits is that brands which track mentions as a first-class KPI alongside reach and engagement consistently outperform on AI visibility six months later. Campaigns that ignored mentions entirely tend to see citation rates stay flat, regardless of how strong the engagement numbers looked at the time.

influencer-campaign-to-brand-mentions-to-ai-citations-flow
Influencer campaigns that generate earned mentions don’t just boost awareness, they build the citation trail AI models use to recommend brands.

Share of voice is the next level. It measures what percentage of category conversations mention your brand versus competitors. If your influencer program increased share of voice from 12% to 19% over a quarter, that’s a measurable gain in category authority, even if direct conversions from the campaign were modest.

For teams already tracking share of voice, our share of voice breakdown covers the calculation methods and tools that work best for influencer-generated data.

How to Set Benchmarks That Aren’t Fiction

A KPI without a benchmark is just a number. “We got 45,000 impressions” means nothing until you know whether 45,000 is excellent, average, or embarrassing for your category, influencer tier, and spend level.

Most brands set benchmarks by Googling “average influencer engagement rate” and copying whatever the first result says. That gives you a generic number from an unknown mix of industries, platforms, influencer sizes, and campaign types. It’s barely better than guessing.

Better approach:

1. Use Your Own Historical Data First

If you’ve run 3+ influencer campaigns, your past performance is the most relevant benchmark you’ve. Beat your own average.

2. Segment by Variables That Actually Matter

Platform, influencer tier (nano/micro/macro/mega), content format (static, video, story, reel), and campaign type (gifted, paid, affiliate). A benchmark that blends all of these together is useless.

3. Ask Your Influencer Partners

Experienced creators know their typical performance ranges. A creator who tells you “my Reels average 3.2% engagement and 1.1% CTR on swipe-ups” is giving you a more accurate benchmark than any industry report.

4. Set Floor and Ceiling Targets

“We need at least 2:1 ROAS to break even, and we’re targeting 5:1” is infinitely more useful than “we want good ROI.”

Where Attribution Breaks Down

The attribution mistake we see most often in influencer-KPI audits is a team trusting last-click tracking for creator campaigns and writing off everything that didn’t convert in the same session. The creator drove the discovery, the branded search two weeks later closed the sale, and the dashboard credits direct traffic. Layer a branded-search lift window and a coupon or creator-specific URL over the raw analytics before drawing conclusions about which creators underperformed.

influencer-attribution-gap-tracked-versus-untracked-impact
Direct attribution captures roughly a third of real influencer impact, the rest happens through channels your analytics tools can’t see.

Attribution is the elephant in every influencer marketing measurement conversation. The data you can track directly, UTM clicks, promo code redemptions, affiliate link conversions, captures only a fraction of the real impact.

The rest happens in ways your analytics tools can’t see. Someone watches an influencer’s story, screenshots the product, sends it to a friend on iMessage, and the friend buys three days later from a Google search. That conversion will never trace back to the influencer. Dark social, brand search lift, word-of-mouth amplification, these are all real revenue drivers that vanish from your dashboard.

This doesn’t mean attribution is pointless. It means you need multiple signals, not one:

  • UTM parameters on every link. Non-negotiable baseline.
  • Unique promo codes per influencer. Captures direct intent.
  • Post-purchase surveys asking “How did you first hear about us?” Captures the untrackable.
  • Branded search volume lift during and after campaigns. If branded searches spike 30% during an influencer push, that’s causal evidence, even without a click trail.
  • Brand mention volume tracking across web, social, and AI surfaces. If mentions jump 40% in the week after a campaign, the influencer drove earned conversation, and that has downstream value you can quantify.

The brands getting influencer measurement right in 2026 aren’t relying on any single attribution method. They’re triangulating across direct tracking, survey data, and brand signals to build a more complete picture. (Yes, it’s more work. But it’s also the difference between “influencer marketing doesn’t work” and “influencer marketing drives 22% of new customer acquisition when measured properly.”)

Earned Media Value: Handle With Care

Earned media value (EMV) is one of the most commonly cited influencer KPIs, and one of the most easily abused.

The basic formula: total impressions ร— CPM rate = EMV. The idea is to translate organic influencer content into an equivalent paid media cost. If an influencer post generated 500,000 impressions and your paid CPM is $12, the EMV is $6,000.

The appeal is obvious. EMV gives you a dollar figure to put in a slide deck. But here’s the problem: there’s no standardized CPM rate. Different tools use different baselines, and the number can swing wildly depending on which CPM you plug in. An EMV of $50,000 from one platform might be $18,000 on another, for the same campaign.

Use EMV as a directional signal, not a hard metric. It’s helpful for comparing relative performance across campaigns you’ve run (as long as you use the same formula each time). It’s unreliable for justifying spend to anyone who asks, “How did you calculate that?”

Building a KPI Dashboard That Leadership Actually Reads

The best measurement system is worthless if the report lands as a 40-row spreadsheet that no one opens after the first meeting.

Keep your influencer report to one page. Three sections:

  1. Headline outcome: Did the campaign hit its primary KPI? CPA was $X (target was $Y). ROAS was Z:1. Brand mention volume increased X%. One line. Clear answer.
  2. Supporting context: 3, 5 supporting metrics that explain why the headline number is what it’s. Engagement rate, reach, CTR, conversion rate. Brief. No more than a table.
  3. What we’ll change next time: One to two tactical adjustments based on the data. “Creator A drove 4x the conversions of Creator B at half the CPE, we’ll shift budget toward micro-influencers in similar niches.” This is what separates reporting from learning.

If you’re running multiple influencer campaigns simultaneously, tools that monitor brand mentions across platforms can feed directly into the awareness layer of your dashboard, giving you a real-time view of earned conversation alongside your direct-response metrics.

Frequently Asked Questions

What are the most important KPIs for influencer marketing?

The most important KPIs depend on your campaign goal. For revenue campaigns, track CPA, ROAS, and conversion rate. For awareness campaigns, track reach, brand mentions, and share of voice. Pick 2, 3 primary KPIs per campaign, not 15.

How do you calculate influencer marketing ROI?

ROI = (revenue from campaign โˆ’ campaign cost) รท campaign cost ร— 100. If you spent $10,000 and generated $58,000 in attributable revenue, your ROI is 480%. The challenge is attribution, promo codes and UTMs capture direct conversions, but post-purchase surveys and branded search lift fill in the gaps from dark social and delayed purchases.

What is a good engagement rate for influencer content?

It depends on platform and influencer size. On TikTok, nano-influencers average around 10% engagement. On Instagram, nano-influencers sit closer to 1.7%. Comparing a TikTok creator to an Instagram creator without adjusting for platform norms will mislead you every time. Use your own historical campaign data as the most reliable benchmark.

Should I track earned media value (EMV)?

Use it as a directional comparison tool, not a hard ROI metric. EMV calculations vary dramatically depending on which CPM rate you use, and there’s no industry standard. If you track EMV, keep the formula consistent across campaigns so you can at least compare relative performance. Never present it as actual revenue.

How do brand mentions connect to influencer marketing KPIs?

Brand mentions measure earned conversation, every instance where your brand name appears in content, comments, reviews, or media beyond the influencer’s own post. They indicate whether a campaign generated word-of-mouth that persists after the paid content ends. Brands that track mentions as an influencer KPI also gain visibility into how those mentions influence AI search recommendations over time.

Using the KPI Dashboard to Plan Next Quarter’s Influencer Slate

Measurement without action is just record-keeping. The point of tracking influencer marketing KPIs isn’t to know what happened, it’s to know what to do next.

If CPA is too high, you either have the wrong influencers, the wrong audience, or the wrong offer. If engagement is strong but conversions are flat, the creative resonates but the landing page or CTA isn’t closing. If brand mentions spiked during the campaign but dropped immediately after, you generated attention without building lasting authority.

Every KPI is a diagnostic. The metric tells you something moved. Your job is to figure out why, and whether it moves the business forward.

The brands that win at influencer marketing in 2026 aren’t the ones with the biggest budgets or the most famous creators. They’re the ones who measure with precision, learn from each campaign, and compound those learnings over time. That’s how you turn influencer spend from a line item into a growth engine.

If you want a baseline before committing to a tool or process, request a quick AI visibility audit. We’ll run 25 category-relevant prompts across ChatGPT, Perplexity, Gemini, and Google AI Overviews so you can see exactly which sources each platform trusts for your category, and which competitors are capturing citations you’re not.

Written by the BrandMentions team, AI visibility strategists who track brand citations across 250+ publications and every major AI search platform.

This article was produced with AI assistance and reviewed by a human editor for accuracy, voice, and editorial quality.

[
,

]

Media Monitoring Report: 7 Sections Worth Tracking

media-monitoring-report-anatomy-components-diagram

A media monitoring report is a structured document that collects, organizes, and analyzes every mention of your brand, competitors, or industry topics across news, social media, broadcast, and digital channels, then translates that raw data into decisions your team can act on. Most reports fail not because the data is missing, but because nobody connects the numbers to what the business should do next. The difference between a report that gets skimmed and one that reshapes your next quarter’s strategy comes down to structure, metric selection, and how clearly you tie coverage patterns to business outcomes.

If you’ve ever sent a spreadsheet of clippings to your leadership team and watched it disappear into their inbox, this is the fix. A strong media monitoring report doesn’t just prove you’re being talked about, it shows where the conversation is heading, who’s driving it, and what your team should do about it.

What You’ll Learn

  • What belongs in a media monitoring report (and what to leave out)
  • The metrics that actually influence decisions, not just decorate slides
  • How to structure reports for different stakeholders, from PR teams to the C-suite
  • Where AI-powered media coverage fits into monitoring in 2026
  • A step-by-step process for building your first report from scratch

What a Media Monitoring Report Actually Covers

A media monitoring report tracks how your brand appears across every channel where public conversation happens: online news outlets, print publications, broadcast TV and radio, podcasts, social media platforms, forums, and, increasingly, AI-generated search responses. The report aggregates these mentions into quantitative metrics and qualitative analysis so teams can measure reputation, benchmark against competitors, and spot emerging risks before they escalate.

Media Monitoring Report, media-monitoring-report-anatomy-components-diagram
A media monitoring report layers raw data, analysis, and recommendations, each component builds on the one beneath it.

But here’s what separates a useful report from a vanity document: scope discipline. Monitoring everything sounds thorough. In practice, it creates noise that buries the signals your team needs. The best reports define their boundaries upfront, which brands, which keywords, which channels, which time window, and hold those boundaries tight.

Think of it as a radar screen. You’re not tracking every aircraft in the sky. You’re watching the ones heading toward your airspace.

Why Most Media Monitoring Reports Get Ignored

The uncomfortable truth: most monitoring reports are data dumps with a logo on them. They list every mention, tally some numbers, and land in inboxes where they die quietly. The problem isn’t the data, it’s the absence of interpretation.

A report that says “You received 1,247 mentions this month, up 12% from last month” tells the reader almost nothing. Up 12% because of a product launch? A crisis? A viral meme? Without context, the number is decoration.

Three patterns show up repeatedly in reports that fail to influence decisions:

1. No Audience Awareness

A report for the CEO should look nothing like a report for the social media manager. Same data, different framing, different depth. When everyone gets the same document, nobody gets what they need.

2. Metrics Without Benchmarks

Raw numbers don’t mean much without a reference point. Is 1,247 mentions good? Compared to what, last quarter, your top competitor, your industry average? Benchmarks turn numbers into judgments.

3. No “So What” Section

Data without recommendations is homework the reader didn’t ask for. Every section of a monitoring report should end with an implication, what this means and what to do about it.

If your report reads like a receipt, it’ll be treated like one. Filed and forgotten.

Metrics That Belong in Every Report

Not all metrics deserve a spot. The ones that earn their place connect directly to a business question someone on your team is trying to answer. Here’s what holds up under scrutiny.

Mention Volume and Trend Direction

Total mentions over the reporting period, broken down by channel. But the raw count matters less than the trend line, is volume growing, shrinking, or spiking in response to specific events? Map mention volume against your campaign calendar and news cycle. The correlation tells the story.

Sentiment Distribution

Sentiment analysis classifies mentions as positive, negative, or neutral based on the language surrounding your brand name. In 2026, most monitoring platforms use natural language processing to automate this, though accuracy still varies, especially with sarcasm, industry jargon, and non-English content. Report the distribution, but always spot-check the classifications manually before presenting to stakeholders.

A ratio shift matters more than absolute numbers. If negative sentiment jumped from 8% to 19% of total mentions in two weeks, that’s a signal, even if the total volume of negative mentions is small.

Share of Voice

Share of voice measures what percentage of the total conversation in your category belongs to your brand versus competitors. It’s one of the few media metrics that directly correlates with market share over time. A strong share of voice measurement gives leadership a competitive context that raw mention counts can’t provide.

Reach and Estimated Impressions

Reach estimates how many people could have seen a mention based on the publication’s audience size. It’s imperfect, reach doesn’t equal readership, but it distinguishes a mention in a niche blog from one in The Wall Street Journal. Include it, but don’t overweight it. A high-reach mention with negative sentiment isn’t a win.

Source Quality and Channel Breakdown

Where are mentions appearing? Tier 1 national outlets, trade publications, social platforms, podcasts, forums? The channel mix reveals whether your media presence is broad or concentrated, and whether it’s reaching the audiences that actually influence buying decisions.

Key Message Pull-Through

This one gets overlooked. Of all your coverage, how much actually includes the messages you’re trying to land? If your PR team pitched a story about your new enterprise product and the resulting coverage focused on your CEO’s personal background instead, volume looks fine but message pull-through is zero. Track the difference.

How to Structure a Report for Different Stakeholders

A single report format for every audience is a shortcut that costs you influence. The data is the same, the framing changes.

Audience What They Need Report Focus Ideal Length
C-Suite / Board Business impact, risk, competitive position Executive summary, share of voice, sentiment trend, 2, 3 recommendations 1, 2 pages
VP of Marketing Campaign performance, channel effectiveness, competitor comparison Mention volume by campaign, channel breakdown, message pull-through, SOV 3, 5 pages
PR / Comms Team Tactical detail, journalist relationships, coverage quality Full mention list, source-by-source analysis, outlet tier, journalist tracking 5, 10 pages + appendix
Crisis Response Speed, severity assessment, narrative tracking Real-time mention velocity, sentiment shift, top amplifiers, recommended response 1 page, updated hourly

The executive summary is the hardest part to write well. It needs to compress a month of coverage into three paragraphs that a CEO can read between meetings and still walk away knowing whether the brand’s public position improved or deteriorated. Start with the verdict. Support with two or three data points. Close with what’s changing next.

Step-by-Step: Building Your First Media Monitoring Report

If you’re starting from zero, don’t try to monitor everything on day one. Start narrow, prove the value, then expand.

Step 1: Define What You’re Monitoring and Why

Pick your primary monitoring targets. At minimum: your brand name (including common misspellings), your CEO or public-facing executives, your top two competitors, and one or two industry topics that affect your market positioning. Write down the business question each target answers. “We monitor [Competitor X] because we need to know when they launch new features before our sales team gets blindsided.”

Step 2: Choose Your Sources and Channels

Don’t default to “everything.” If your buyers read industry trade publications and LinkedIn but don’t use Reddit, weight your monitoring accordingly. Most media monitoring tools let you filter by source type, geography, and language. Use those filters aggressively.

Step 3: Set Your Reporting Cadence

Weekly reports work for most teams. Monthly reports work for executive summaries and board decks. Daily or real-time monitoring is reserved for crisis situations or major launches. Pick the cadence that matches your decision-making speed, if nobody acts on the data between reports, you’re reporting too often.

Step 4: Build the Template

Lock your structure so reports are comparable over time. A shifting format makes trend analysis impossible. Your template should include: executive summary, mention volume and trend, sentiment breakdown, share of voice, top coverage highlights (with links), competitive comparison, and recommendations.

Step 5: Analyze, Don’t Just Aggregate

This is where most teams stop too early. Pulling data into a template isn’t analysis. Analysis means explaining why the numbers moved, connecting coverage patterns to business events, and recommending specific actions. “Negative sentiment increased 11%, driven primarily by three articles about our pricing change. Recommended response: publish a pricing FAQ and brief the sales team with talking points.” That’s a report that changes behavior.

media-monitoring-report-building-steps-layered-process
Each step refines raw mention data into progressively more strategic output, the bottom layer is where reports earn their value.

The AI Coverage Gap Most Reports Miss

For the per-platform walkthroughs behind an AI-coverage addendum, see checking brand mentions in ChatGPT and the Perplexity brand audit, and tracking your brand across LLMs covers the cross-platform cadence that feeds directly into the AI section described below.

Here’s an opinion most monitoring guides won’t give you: if your media monitoring report only covers traditional and social channels, it’s already incomplete.

In 2026, a growing share of how people discover and evaluate brands happens inside AI-generated responses, ChatGPT, Perplexity, Gemini, Google AI Overviews. When someone asks an AI assistant “What’s the best project management tool for remote teams?” and your competitor gets named but you don’t, that’s a media mention that never appears in your Meltwater dashboard.

Traditional monitoring tools weren’t built to track this. They scrape published web pages, broadcast transcripts, and social feeds. They don’t query AI models to see whether your brand is being recommended in conversational search. That’s a blind spot, and it’s widening.

The pattern we see in monitoring audits is that brands with sustained mentions on category-relevant editorial sites are cited in AI answers at materially higher rates than those leaning on owned content alone. Your report should include a section, even a brief one, that tracks whether AI platforms mention your brand in relevant category queries. Tools for tracking brand mentions in AI search are still maturing, and ignoring the channel entirely means your report understates your real competitive position.

Common Metrics That Waste Space in Reports

Some metrics survive in reports through inertia, not usefulness. Cut these or demote them to an appendix.

Ad Value Equivalency (AVE). AVE estimates what your earned coverage would have cost as paid advertising. The PR industry has been moving away from AVE for years because the comparison is fundamentally flawed, editorial coverage and paid ads don’t influence audiences the same way. The AMEC Integrated Evaluation Framework explicitly recommends against using AVE as a primary metric. If your C-suite still asks for it, include it with a footnote, but don’t let it anchor your report.

Raw mention count without context. Already covered, but worth repeating. A thousand mentions during a crisis is bad. A thousand mentions during a launch is (probably) good. The number alone is meaningless.

Follower counts of social amplifiers. A journalist with 4,000 highly engaged followers in your target industry is more valuable than a lifestyle influencer with 200,000 followers who will never buy your product. Report influence by relevance, not size.

How Often Should You Update a Media Monitoring Report?

The right reporting cadence depends on your business velocity and the decisions the report feeds. Weekly reports suit most marketing and PR teams running ongoing campaigns. Monthly reports work for board-level summaries and long-term trend analysis. Real-time dashboards are reserved for active crises or major product launches where response time is measured in hours.

One pattern worth adopting: maintain a living dashboard that updates continuously (most monitoring platforms support this), and produce a curated analysis report on a fixed schedule. The dashboard answers “what’s happening right now.” The report answers “what does it mean and what should we do.” Both are necessary. Neither replaces the other.

If you’re producing reports but nobody references them in meetings or planning sessions, the cadence might be fine, the content probably isn’t actionable enough. Go back to the “so what” test.

Tracking Competitors Inside Your Report

Your brand doesn’t exist in isolation. A monitoring report that only covers your own mentions misses half the strategic picture.

Include a competitor section that tracks at least your top two or three rivals across the same metrics you use for your own brand: mention volume, sentiment, share of voice, and key narrative themes. The goal isn’t to obsess over competitors, it’s to contextualize your own performance.

media-monitoring-report-competitor-comparison-matrix
A competitor comparison matrix turns your brand’s raw data into relative positioning, the gaps are where the strategic insights live.

When your share of voice drops from 34% to 28%, the cause might be internal (fewer campaigns, less news) or external (a competitor launched something that dominated the conversation). Without competitor data in the same report, you can’t tell the difference. A detailed competitor analysis approach strengthens every section of the monitoring report because it converts your brand’s raw numbers into relative positioning.

One practical tip: track competitor message themes, not just volume. If a rival starts getting consistent coverage around “AI-powered analytics” and you’re positioned in the same space, that’s a signal to evaluate whether your messaging needs sharpening, before the narrative locks in without you.

Tools That Make Reporting Faster (Without Replacing Judgment)

Automation handles the collection and aggregation layers well. Platforms like Meltwater, Cision, Sprinklr, and Critical Mention can pull mentions from thousands of sources, classify sentiment, and generate dashboards in near real-time. That’s valuable, it saves hours of manual clipping and counting.

Where automation falls short is interpretation. No platform reliably explains why sentiment shifted, whether a trending narrative is a threat or an opportunity, or what your team should do in response. That layer still requires a person who understands the business, the competitive landscape, and the audience.

The best workflow: let the tool handle data collection, filtering, and visualization. Then invest your team’s time in the 20% of the report that creates 80% of the value, the analysis, the “so what,” and the recommendations. If your monitoring platform offers customizable report templates, use them to standardize the data sections so your analysts can focus on interpretation rather than formatting.

For teams also tracking brand sentiment analysis at a deeper level, combining automated sentiment scores with manual qualitative review of top-tier coverage produces the most accurate picture. Trust the machine for volume. Trust your team for nuance.

What a Strong Executive Summary Looks Like

The executive summary is the only section some stakeholders will read. Write it last, after all the analysis is done, so it reflects the complete picture.

A strong executive summary follows this rhythm:

1. Verdict First

“Brand visibility improved in Q2 with a 17% increase in share of voice and a positive sentiment shift driven by the product launch campaign.”

2. Two to Three Supporting Data Points

“Total mentions reached 3,841 across 127 unique outlets. Coverage in tier-1 publications increased 23% quarter over quarter. Competitor X’s share of voice declined from 31% to 24%.”

3. One Risk or Watch Item

“Negative coverage around the pricing update in trade media warrants a response strategy before renewal season.”

4. One Forward-Looking Recommendation

“Recommend increasing executive thought leadership placements in Q3 to sustain the momentum from launch coverage.”

That’s it. Four components. Half a page. A busy executive can absorb it in 90 seconds and walk into a meeting knowing the brand’s media position without reading the full report.

Mistakes That Undermine Report Credibility

The credibility mistake we see most often when reviewing monitoring reports is a team that counts every mention as equivalent, regardless of source tier. One placement in a category-defining trade publication can move pipeline in ways a hundred low-relevance roundups can’t, and when the executive summary hides that distinction the whole report reads like noise. Tier your sources in the appendix and surface the top-tier movements on page one.

Even well-structured reports can lose trust quickly. These are the credibility killers.

Cherry-picking positive coverage. If the report only highlights wins and buries negative mentions in an appendix, leadership will eventually find out, and they’ll stop trusting the report entirely. Include negative coverage prominently. Frame it with context and a recommended response. That’s how you build credibility, not by hiding problems.

Inconsistent methodology between periods. If you changed your keyword list, added a new source, or adjusted your sentiment model between reporting periods, say so. Otherwise, a quarter-over-quarter “improvement” might just be measurement noise. Methodological transparency is boring but it’s what makes trend analysis reliable.

Presenting correlation as causation. “We launched the campaign and mentions increased 40%.” Maybe. Or maybe a competitor had a public crisis and journalists came to you for commentary. Don’t overstate what the data proves. Honest interpretation builds more long-term trust than inflated claims. (Yes, this applies even when the inflated version would make your team look better.)

Frequently Asked Questions

What is a media monitoring report used for?

A media monitoring report is used to track, measure, and analyze how a brand appears across news, social media, broadcast, and digital channels, then translate those findings into strategic recommendations. PR teams use it to prove campaign impact. Marketing leaders use it to benchmark against competitors. Executives use it to assess brand reputation and spot emerging risks.

How long should a media monitoring report be?

Length depends on the audience. An executive summary should fit on one page. A full tactical report for the PR team might run 5, 10 pages plus appendices. The governing rule: if a section doesn’t lead to a decision or action, cut it. A three-page report that drives strategy beats a twenty-page report that collects dust.

Can I build a media monitoring report with free tools?

You can get a basic version started. Google Alerts, free social listening tools, and manual tracking in a spreadsheet will cover low-volume monitoring. But free tools lack automated sentiment analysis, share of voice calculations, and cross-channel aggregation. Once you’re monitoring more than one brand across multiple channels, the manual overhead becomes unsustainable. That’s the point where a dedicated monitoring platform pays for itself in time savings alone.

Should a media monitoring report include AI search mentions?

In 2026, it should, even if the coverage is limited. AI platforms like ChatGPT, Perplexity, and Gemini are influencing how buyers discover and evaluate brands. Imagine a prospect asks an AI assistant about solutions in your category and your competitor gets recommended while you don’t. That’s a visibility gap your traditional monitoring dashboard won’t catch. Even a brief section tracking AI mentions adds a forward-looking dimension to your report that most competitors are still ignoring.

Adapting Your Report as AI Surfaces Mature

The reporting stack is shifting. Static PDF reports sent monthly are giving way to live dashboards with curated analysis layers on top. AI-assisted summarization is making it faster to generate first drafts of executive summaries. And the definition of “media” keeps expanding, podcasts, video transcripts, AI-generated answers, and community forums all produce mentions that didn’t factor into monitoring five years ago.

The brands that will get the most value from monitoring reports in the next two years are the ones that treat the report as a decision-making tool, not a record-keeping exercise. Structure it around questions your team is actually trying to answer. Update the metrics when the business questions change. And make sure every section ends with something someone can do, not just something they can know.

If you want a baseline before committing to a tool or process, request a quick AI visibility audit. We’ll run 25 category-relevant prompts across ChatGPT, Perplexity, Gemini, and Google AI Overviews so you can see exactly which sources each platform trusts for your category, and which competitors are capturing citations you’re not.

Written by the BrandMentions editorial team. AI-assisted drafting with human editorial oversight, fact-checking, and final review.

Brand Tracking Agencies: How to Pick the Right One

brand-tracking-agencies-three-types-comparison-matrix

Brand tracking agencies are specialized firms that measure how consumers perceive, recall, and prefer your brand over time, using surveys, social listening, AI monitoring, or a combination of all three. They turn raw perception data into dashboards, reports, and strategic recommendations that connect brand health to business outcomes like pipeline growth, market share, and pricing power.

But the category has fractured. In 2026, “brand tracking” can mean anything from a panel-based awareness study to real-time AI citation monitoring across ChatGPT, Perplexity, and Gemini. Some agencies run quarterly surveys. Others scrape social sentiment daily. A growing number now track whether AI models actually recommend your brand when buyers ask for solutions in your category. The right partner depends entirely on what you’re trying to measure, and where your buyers are looking.

This guide breaks down the types of brand tracking agencies operating right now, what separates the strong ones from the generic ones, and how to match an agency’s methodology to your actual business goals. No vendor rankings. No affiliate links. Just a decision framework you can use this week.

What You’ll Learn

  • The three distinct types of brand tracking agencies and what each actually measures
  • Evaluation criteria that go deeper than “do they have a nice dashboard”
  • Why AI visibility tracking is now a core part of brand health, not a separate discipline
  • Red flags that signal an agency is selling outdated methodology
  • How to build a shortlist based on your company size, budget, and data maturity

Three Types of Brand Tracking Agencies (and What Each Actually Measures)

Most comparison lists lump every brand tracking agency into one bucket. That’s a mistake. The methodology determines what you learn, how fast you learn it, and whether the data connects to revenue.

Here’s how the category actually breaks down:

Survey-Based Brand Trackers

These agencies run structured research programs, typically quarterly or continuous, that measure aided and unaided awareness, consideration, preference, usage, and loyalty. They rely on consumer panels, often surveying thousands of respondents per wave to track shifts in perception over time.

Firms like YouGov, Kantar, Latana, and Tracksuit fall into this category. YouGov, for instance, surveys its panel daily across 16 brand health metrics and benchmarks results against over 27,000 brands in the US alone. Kantar’s BrandZ methodology ties perception data to financial valuation through its “Meaningful, Different, Salient” framework.

The strength here is statistical rigor. The weakness? Lag. Survey data reflects what people say they think, not necessarily what they do when they’re actively evaluating vendors. And survey-based tracking tells you nothing about whether AI search surfaces your brand at the moment of decision.

Social and Media Monitoring Agencies

These firms track brand mentions, sentiment, and share of voice across social platforms, news outlets, forums, review sites, and the broader web. Think Brandwatch, Meltwater, Brand24, and agencies that build custom dashboards on top of these platforms.

Brand Tracking Agencies, brand-tracking-agencies-three-types-comparison-matrix
Each type of brand tracking agency measures a different layer of brand health, and leaves different blind spots.

The data is real-time. You’ll know within hours if a PR crisis is brewing or if a competitor’s campaign just shifted the conversation. But social monitoring measures volume and sentiment, not the structured perception metrics (consideration, preference, loyalty) that survey-based trackers deliver.

For B2B brands, there’s another gap: most social listening tools are calibrated for consumer conversations on X, Reddit, and Instagram. They miss the quieter signals, Slack communities, niche forums, analyst reports, and AI-generated answers, where B2B purchase decisions actually form.

AI Visibility and Citation Tracking Agencies

This is the newest category, and it’s growing fast. These agencies monitor whether AI models, ChatGPT, Gemini, Perplexity, Claude, AI Overviews, mention, recommend, or cite your brand when users ask category-relevant questions.

The logic is straightforward: if a buyer asks ChatGPT “What’s the best project management tool for remote teams?” and your brand doesn’t appear, you’ve lost a touchpoint that no amount of survey data or social listening will recover. AI visibility agencies track these citation patterns, identify the content and entity signals that drive recommendations, and build strategies to improve your brand’s presence in AI-generated answers.

Brand tracking agencies that monitor AI citations measure something fundamentally different from survey or social trackers, they measure whether your brand appears at the exact moment a buyer asks an AI assistant for a recommendation in your category.

The pattern we see repeatedly in BrandMentions citation audits is consistent: the brands that show up in AI responses are the ones with strong entity authority across category-relevant editorial sources. Not just any mentions, the right mentions, on the right publications, structured in ways models can parse and trust.

What Makes a Brand Tracking Agency Worth Hiring?

Agency websites all promise “actionable insights” and “data-driven strategy.” That language is meaningless. Here’s what actually separates a strong partner from an expensive dashboard subscription.

Methodology Transparency

Ask any prospective agency: How do you collect data, how large are your samples, how do you weight results, and what are the known limitations?

A good agency answers this in the first meeting, without hedging. A bad one talks about “proprietary algorithms” and changes the subject. Survey-based trackers should disclose panel composition, response rates, and margin of error. Social monitors should explain how they handle bot traffic, sarcasm detection, and platform coverage gaps. AI visibility agencies should clarify which models they track, how frequently, and how they account for the non-deterministic nature of LLM outputs.

If an agency can’t explain its methodology to a VP of Marketing in plain language, that’s a red flag, not a sign of sophistication.

Metric-to-Decision Mapping

Data without a decision framework is just noise. The best brand tracking agencies don’t just report numbers, they connect each metric to a specific business decision.

Awareness dropped 3 points among 25, 34 year olds? That tells the media team where to shift spend. Consideration is flat despite strong awareness? That’s a messaging problem, not a reach problem. Your brand is cited by Perplexity for “best CRM for startups” but invisible on ChatGPT? That’s a content gap in the publications ChatGPT’s training data weights most heavily.

Ask agencies for a sample report before signing. Look at whether the deliverables include “so what” and “now what”, or just charts.

Competitive Benchmarking Depth

Tracking your own brand in isolation is almost useless. Every metric only matters relative to competitors and category norms. A strong agency benchmarks your awareness, sentiment, share of voice, and (increasingly) AI citation share against a defined competitive set.

The benchmarking should be specific enough to show where you’re winning and where you’re losing, not just a generic percentile ranking. Ask: Can you show me how my brand’s consideration rate compares to my top three competitors among our target ICP?

Refresh Cadence That Matches Your Decisions

Quarterly tracking made sense when brand strategy decisions happened quarterly. That cadence is too slow for most companies now. Social sentiment shifts in hours. AI model behavior changes with every training data refresh.

brand-tracking-agency-decision-framework-branching-tree
Start with the decisions you need to make, then work backward to the tracking approach that feeds those decisions.

Match the tracking cadence to your decision cycle. Running weekly campaigns? You need weekly (or continuous) monitoring. Planning annual brand strategy? Quarterly waves still work for the survey layer, but supplement with real-time social and AI monitoring between waves.

Why AI Visibility Belongs in Every Brand Tracking Program Now

For the per-platform walkthroughs this AI-tracking layer actually runs on, see how ChatGPT shows your brand and monitoring Perplexity for citations, and brand mention tracking inside language models covers the cross-platform cadence a tracking agency should be running.

Here’s a stance most traditional brand tracking agencies won’t take: if your brand tracking program doesn’t include AI citation monitoring in 2026, it’s measuring a shrinking portion of how buyers actually discover and evaluate brands.

According to a 2024 Gartner forecast, traditional search engine volume is projected to drop 25% by 2026 as AI-powered assistants absorb more discovery queries. That projection is playing out. Buyers, especially in B2B, are increasingly asking ChatGPT, Perplexity, and Gemini for vendor shortlists, product comparisons, and category recommendations.

The brands that appear in those AI-generated answers aren’t random. They’re the ones with strong entity authority: consistent, structured mentions across high-authority publications that LLMs ingest during training and retrieval. A traditional brand tracker will tell you your awareness is stable. An AI visibility tracker will tell you that your competitors are getting cited by ChatGPT and you’re not, which matters more if that’s where your buyers start their research.

This doesn’t mean survey-based tracking is obsolete. It means it’s incomplete on its own. The smartest brand teams are layering AI citation tracking on top of their existing programs, not replacing them.

Evaluating Brand Tracking Agencies: A Practical Checklist

Skip the “schedule a demo and see if we vibe” approach. Use this before your first call to disqualify agencies that can’t meet your actual needs.

Evaluation Criteria What to Ask Red Flag Answer
Methodology How do you collect and validate data? “Our proprietary system” with no specifics
Sample quality Panel composition, response rates, fraud controls? Can’t disclose panel sourcing or quality checks
Competitive coverage How many competitors can you benchmark simultaneously? “We focus on your brand only”
Cadence flexibility Can I adjust tracking frequency without renegotiating? Annual contract locked to quarterly waves only
AI visibility layer Do you track brand citations in AI-generated answers? “That’s a different discipline, we don’t cover it”
Deliverable quality Can I see a sample report before signing? Refuses or shows only a generic template
Integration Does your data feed into our BI tools / CRM? PDF reports only, no API or data export
Strategic support Who interprets results and recommends actions? “The dashboard is self-service, you’ll figure it out”

Print this. Bring it to the call. If an agency struggles with more than two of these, they’re probably selling a product, not a partnership.

How to Match an Agency to Your Company Stage

A Series A startup and a Fortune 500 enterprise need fundamentally different things from a brand tracking partner. Buying the wrong tier wastes budget. Buying the wrong methodology wastes time.

Early-Stage Startups ($0, $5M ARR)

You don’t need a full-scale brand tracking program yet. What you need is a baseline: Do people in your target market know you exist? When they hear your name, what do they associate it with? Does AI search mention you at all?

A lightweight approach works here. Use a DIY survey tool like Pollfish or SurveyMonkey for a quarterly awareness pulse. Pair it with free social listening tools for real-time sentiment. And check your AI visibility manually, ask ChatGPT, Perplexity, and Gemini the questions your buyers ask, and see if your name appears.

Budget: $500, $3,000/quarter for the survey layer. Free to low-cost for social and AI monitoring at this stage.

Growth-Stage Companies ($5M, $50M ARR)

This is where structured tracking pays off. You’ve got a brand to protect, competitors to watch, and marketing spend that needs justification.

Invest in a mid-tier tracking agency, Latana, Tracksuit, Attest, or Qualtrics, that can run continuous or quarterly brand health studies with competitive benchmarking. Layer on a social monitoring tool for real-time coverage. And start tracking AI visibility systematically, either through a specialized agency or an AI visibility analytics platform.

Budget: $15,000, $60,000/year depending on markets, segments, and cadence.

Enterprise ($50M+ ARR)

Enterprise brand tracking is multi-layered by necessity. You’re likely tracking across multiple markets, segments, product lines, and languages.

brand-tracking-agencies-by-company-stage-stacked-layers
Brand tracking programs should build in layers as your company scales, not start from scratch at each stage.

Kantar and YouGov dominate this tier for survey-based tracking. Brandwatch and Meltwater handle social and media monitoring at scale. For AI visibility, the challenge is different, enterprise brands need to track citations across multiple AI platforms, multiple product categories, and multiple geographies simultaneously.

The biggest mistake enterprise teams make: treating each tracking layer as a separate vendor relationship with separate reports. The agencies that deliver the most value are the ones that can integrate findings across layers, or at least export clean data into your existing BI stack.

Budget: $100,000, $500,000+/year across all layers.

The Metrics That Actually Matter (and the Ones That Don’t)

Every brand tracking agency will give you a dashboard full of metrics. Most of those metrics are vanity signals dressed up in professional charts. Here’s what to actually pay attention to.

Worth Tracking

Unaided awareness, the percentage of your target market that names your brand without prompting. This is the hardest metric to move and the most honest measure of brand strength. If unaided awareness isn’t growing, your brand-building efforts aren’t working yet. Period.

Consideration, the percentage that would include your brand when evaluating options in your category. The gap between awareness and consideration is where messaging problems live. High awareness + low consideration = people know you but don’t trust you enough to evaluate you.

AI citation share, how often AI models mention your brand relative to competitors when users ask category-relevant questions. This metric didn’t exist three years ago. Now it’s one of the most predictive indicators of future share-of-voice measurement. In campaigns we’ve run across B2B SaaS categories, brands with higher AI citation share consistently see stronger organic pipeline growth within two to three quarters.

Net Promoter Score (or better: advocacy rate), willingness to recommend. Not because NPS is perfect (it’s not), but because recommendation intent is the most commercially predictive perception metric available.

Less Useful Than Agencies Suggest

Aided awareness, “Have you heard of Brand X?” Almost everyone says yes. The ceiling effect makes this metric nearly useless for differentiation.

Raw mention volume, 10,000 mentions means nothing if 8,000 are irrelevant noise, bot activity, or negative sentiment. Volume without sentiment and context is a distraction.

Brand attribute scores without competitive context, knowing that 62% of respondents associate your brand with “innovation” is meaningless unless you know the same number for your top three competitors. Insist on competitive benchmarks for every attribute.

Red Flags When Evaluating Brand Tracking Agencies

The evaluation red flag we watch for most is any agency that won’t share their raw prompt set or raw survey items for your category. A tracker’s methodology should be boring and fully visible by the third conversation. If “proprietary” starts doing heavy lifting, you’re buying a dashboard, not data you can defend to leadership six months in.

Some of these are obvious. Some are subtle. All of them will cost you money and time.

They can’t show you a sample deliverable. If the agency won’t share a redacted report or sample dashboard before you sign, they’re either ashamed of their output or banking on your sunk-cost commitment after onboarding. Walk away.

They treat “brand tracking” and “social listening” as the same thing. Social listening is one input to brand tracking. It’s not the whole picture. An agency that equates the two doesn’t understand the category deeply enough to guide your strategy. (And yes, several SERP-ranking “brand tracking” articles in 2026 still make this mistake.)

They promise guaranteed improvements in brand perception. Brand perception is influenced by product quality, customer experience, competitive moves, PR, and macroeconomic conditions, not just the tracking agency’s work. An honest agency tells you what they can measure and what they can recommend. They don’t guarantee outcomes they can’t control.

Their pricing is per-metric, not per-program. Some agencies charge separately for awareness, consideration, loyalty, and each additional metric. This incentivizes you to track less, which is the opposite of what you need. Look for program-based pricing that includes a full metric suite.

They don’t track AI visibility, and dismiss it when asked. Any brand tracking partner in 2026 that treats AI citation monitoring as a fad or a “nice-to-have” is behind the curve. You don’t need them to do it themselves, but they should at least acknowledge its importance and integrate with partners who do.

How to Build a Shortlist in 5 Steps

1. Define Your Primary Tracking Objective

Are you measuring the ROI of a rebrand? Benchmarking against a new competitor? Monitoring AI visibility for the first time? The objective determines the methodology, and the methodology narrows the agency pool immediately.

2. Map Your Tracking Layers

Survey-based perception + social/media monitoring + AI citation tracking. Decide which layers you need now and which you’ll add later. Few agencies cover all three, and that’s fine. Better to hire specialists than accept mediocre coverage from a generalist.

3. Set Your Budget Ceiling Before You Talk to Anyone

Agencies will happily scope a $200,000 program for a company that should be spending $30,000. Know your range and lead with it.

4. Request Sample Deliverables From Your Top 3, 4 Candidates

Compare them side by side. Look for insight density, how much “so what” appears per page. A 40-page report with two actionable findings is worse than a 10-page report with eight.

5. Run a 90-Day Pilot Before Committing Annually

Most reputable agencies offer pilot programs. Use the pilot to test data quality, reporting cadence, and how well the agency’s recommendations integrate with your existing decision-making process.

The Agencies Most Often Mentioned in This Category

For reference, not as an endorsement, here are the agencies and platforms that appear most frequently in brand tracking conversations and SERP results in 2026. Use this as a starting point for your shortlist, not a final answer.

Agency / Platform Primary Approach Best Fit
YouGov Panel-based survey tracking (daily, continuous) Enterprise brands wanting always-on perception data
Kantar Full-service research + brand valuation Global enterprises needing multi-market brand equity measurement
Latana Mobile-first brand tracking with AI segmentation Growth-stage companies wanting targeted audience tracking
Tracksuit Affordable always-on brand tracking Mid-market brands wanting continuous data without enterprise pricing
Attest DIY consumer research with built-in brand tracking Lean teams running their own tracking in-house
Qualtrics Full-suite experience management with brand module Enterprises already in the Qualtrics ecosystem
Brandwatch Social listening + consumer intelligence Brands needing real-time social and media monitoring
Meltwater Media monitoring + social listening PR-driven organizations tracking earned media and sentiment
BrandMentions AI visibility tracking + citation building B2B brands needing to appear in AI-generated recommendations

Worth noting: these firms don’t all compete directly. YouGov and Brandwatch solve different problems. Kantar and BrandMentions measure different surfaces. A strong brand tracking program in 2026 often involves two or three partners covering complementary layers.

brand-tracking-program-anatomy-multiple-agency-layers
A modern brand tracking program combines survey, social, and AI citation data into one strategic view, often from different specialist agencies.

Tracking agencies are one slice of the broader category. Our overview of brand mentions service models covers how tracking-only agencies differ from full-service citation-building partners.

Frequently Asked Questions

How much do brand tracking agencies charge?

It depends heavily on methodology and scope. DIY survey tools start around $500/quarter. Mid-tier agencies like Latana or Tracksuit typically run $15,000, $60,000/year. Enterprise programs from Kantar or YouGov can exceed $200,000/year when tracking across multiple markets and product lines. AI visibility tracking from specialist agencies is usually priced separately, often starting at $2,000, $5,000/month depending on the number of categories and competitors monitored.

Can one agency handle all three tracking layers?

Rarely, and that’s okay. A few large firms like Kantar offer survey tracking and some social monitoring, but their AI citation capabilities are limited. Most brands in 2026 work with two or three specialist partners. The key is making sure the data can be integrated, through shared dashboards, BI tool exports, or at minimum, a unified reporting cadence.

How long does it take to see meaningful data from a new tracking program?

For survey-based tracking, you typically need two to three waves (6, 9 months for quarterly programs) before you’ve enough data to identify statistically significant trends. Social monitoring delivers value within the first week. AI citation tracking can show your baseline position within days, though measuring the impact of improvement efforts takes 60, 90 days as new content gets indexed and ingested by AI models.

What’s the difference between brand tracking and brand monitoring?

Brand tracking measures how perceptions change over time through structured research, awareness, consideration, preference, loyalty. Brand monitoring watches for real-time mentions and sentiment shifts across media and social channels. Tracking is about trends. Monitoring is about signals. Most companies need both, but they answer different questions. A full picture in 2026 adds a third layer: AI visibility tracking, which measures whether your brand appears in AI-generated recommendations.

Do I need a brand tracking agency if I already use Google Analytics and social media dashboards?

Yes, those tools measure your own channels. They tell you who visited your website and engaged with your social posts. Brand tracking measures something entirely different: what people think about your brand whether or not they visit your website. A buyer might have strong negative associations with your brand without ever clicking a link. A brand tracking agency surfaces those perceptions before they show up as lost deals in your CRM. Imagine a competitor’s rebrand shifted perception in your category, and your pipeline dipped, Google Analytics won’t tell you why. A brand tracker will.

Designing a 2026 Brand Tracking Program That Covers All Three Surfaces

The agencies in this space will continue to specialize. Survey trackers will get faster. Social monitors will get smarter at filtering noise. AI visibility agencies will expand coverage as new models launch and existing ones evolve.

Your job isn’t to predict which vendor will dominate in three years. It’s to build a tracking program now that covers the three surfaces where brand perception actually forms: structured research, real-time media, and AI-generated answers. Get the layers right, hire specialists for each, and make sure the data flows into decisions, not just dashboards.

If you don’t yet have a baseline for how AI search engines describe your brand, that’s the gap to close first. It’s the fastest-growing discovery surface and the one most brand tracking programs still ignore.

If you want a baseline before committing to a tool or process, request a quick AI visibility audit. We’ll run 25 category-relevant prompts across ChatGPT, Perplexity, Gemini, and Google AI Overviews so you can see exactly which sources each platform trusts for your category, and which competitors are capturing citations you’re not.

Written by the BrandMentions team. AI-assisted drafting, human-edited and reviewed.

Frequently Asked Questions

Are brand measurement agencies different from brand tracking agencies?

Brand measurement and brand tracking agencies overlap heavily but differ in emphasis. Brand tracking agencies focus on continuous longitudinal data: monthly mention counts, share of voice, sentiment trends. Brand measurement agencies emphasize point-in-time studies: brand health surveys, awareness benchmarks, attribution modeling. Most agencies offer both. If your need is “how is my brand performing every month,” pick a tracking agency. If your need is “what is my brand worth today vs last quarter,” pick a measurement agency.

How to Create a Google News Alert in 3 Minutes (2026)

google-news-alert-setup-to-delivery-pipeline-diagram

Create google news alert, Google News alerts (sometimes called a Google news alert in singular form, or Google company news alerts when you track a competitor brand) are one of the fastest ways to monitor what’s being published about your brand, your competitors, or any topic you care about, and you can set one up in under two minutes at google.com/alerts. This guide covers how to create a Google news alert, how to create a Google alert in general, how to set up Google news alerts that deliver via email, and the official Google alerts create alert 2026 workflow that the Google alerts help center walks through. We also explain how creating a Google news alert differs from a standard Google alert and what setup choices matter most. Type your search term, choose “News” as the source, pick a delivery frequency, and hit “Create Alert.” That’s it. Google will email you whenever it finds new news articles matching your query.

But here’s what most guides won’t tell you: Google Alerts catches only a fraction of what’s actually published. The tool hasn’t changed much in over a decade, and its coverage has notable blind spots, especially for brand monitoring across AI search, social media, and niche publications. If you’re relying solely on Google News alerts for reputation management or competitor intelligence, you’re working with an incomplete picture.

This guide walks you through the full setup process, shows you how to write alert queries that actually return relevant results, and covers what to do when Google Alerts isn’t enough.

What You’ll Learn

For teams searching the official Google alerts create alert 2026 documentation or how to set up Google alerts step by step 2026, this guide mirrors the official Google alerts setup workflow with the practical decisions Google’s help docs leave out (which delivery time to pick, when to use exact-match keyword wrapping, how to throttle high-volume alerts).

  • Step-by-step setup for Google News alerts, including advanced query tricks most people skip
  • How to customize alert frequency, sources, and delivery to reduce noise
  • Where Google Alerts falls short, and what to pair it with for full brand coverage
  • How to monitor brand mentions across AI search platforms like ChatGPT and Perplexity, not just traditional news

What Is a Google News Alert?

A Google News alert is an automated email notification that Google sends when it indexes new content matching a search query you’ve defined. When you restrict the source to “News,” the alert filters results to news publications and major editorial outlets indexed by Google News.

Create Google News Alert, google-news-alert-setup-to-delivery-pipeline-diagram
A Google News alert follows a simple path: you define the query, Google scans its news index, and matching results land in your inbox on schedule.

Google Alerts itself is a free monitoring service that’s been around since 2003. You don’t need any special software, just a Google account and a web browser. The tool scans Google’s index on your chosen schedule and delivers matching results to your inbox.

The distinction between “Google Alerts” and “Google News alerts” trips people up. Google Alerts is the tool. A Google News alert is what you get when you set the source filter to “News” within that tool. You can also track blogs, web results, video, books, discussions, and finance, or leave it on “Automatic” to pull from all sources.

How to Create a Google News Alert: Step by Step

The whole process takes about 90 seconds. Here’s exactly what to do.

1. Sign Into Your Google Account

Go to google.com/alerts. If you’re not already logged in, sign in with the Gmail address where you want to receive alerts.

2. Enter Your Search Term

Type your keyword, brand name, or phrase into the search bar at the top. A preview of results will appear below so you can check relevance before committing.

3. Click “Show Options.”

This expands the customization panel, and it’s where most people stop too early. Don’t skip this step.

4. Set the Source to “News.”

Under “Sources,” select “News” from the dropdown. This restricts your alert to Google News, indexed publications instead of the entire web.

5. Choose Your Frequency

Options are “As-it-happens,” “At most once a day,” or “At most once a week.” For brand monitoring, daily works for most teams. As-it-happens can flood your inbox on high-volume topics.

6. Select Language and Region

Choose “English” and “United States” if you’re tracking U.S. coverage. You can create separate alerts for other regions.

7. Pick “Only the Best Results” or “All Results.”

“Only the best results” applies a quality filter. For brand monitoring, start with “All results”, you don’t want Google deciding what’s important about your brand.

8. Set the Delivery Email

Confirm the correct email address, or add an alternative. You can also deliver alerts to an RSS feed instead.

9. Click “Create Alert.”

Done. Your alert is now active.

You can create up to 1,000 alerts per Google account. There’s no cost involved, the entire service is free.

How to Write Better Alert Queries

The filter discipline we watch for most: teams set up 10 alerts on week one and then never prune them. Six months later the alerts fire 30 times a day, no one opens the email, and the whole program is effectively dead. Review alert volume monthly. Any alert generating more than 5 irrelevant results a week should either get tighter query operators or get deleted.

The query you type determines whether you get useful results or a wall of irrelevant noise. Most people type a single word and wonder why their alerts are useless.

Use exact-match quotes for multi-word terms. If you’re tracking your company name, wrap it in quotation marks: "Acme Software". Without quotes, Google matches pages containing “Acme” and “Software” separately, which pulls in every unrelated mention of either word.

Exclude noise with the minus operator. If your brand shares a name with something unrelated, add exclusions: "Mercury" -planet -retrograde -NASA. This removes results about the planet Mercury from alerts about your brand.

Use the OR operator for variations. Track multiple brand name spellings or product names in one alert: "BrandName" OR "Brand Name" OR "brandname.com". Each variation catches mentions the others would miss.

Restrict to specific sites when needed. Want alerts only from a particular publication? Use site:techcrunch.com "your brand". This is useful for tracking coverage on outlets that matter most to your audience.

A pattern we watch for in monitoring campaigns: brands that set up generic, unrefined alerts abandon them within two weeks because of inbox overload. The ones that invest five extra minutes crafting precise queries keep using them for months.

Query Examples That Actually Work

Goal Query Why It Works
Track your brand "Acme Software" OR "AcmeSoft" Catches both name formats, exact match only
Monitor a competitor "Competitor Inc" -jobs -careers Filters out job postings that flood results
Track industry news "AI visibility" OR "AI brand mentions" Covers multiple terms in one alert
Watch a specific outlet site:reuters.com "your industry term" Limits results to one trusted source
Monitor your CEO "Jane Smith" "Acme Software" Requires both terms to appear together

How to Edit or Delete an Existing Alert

Go to google.com/alerts. You’ll see a list of every active alert tied to your account.

To edit, click the pencil icon next to any alert. The same customization panel opens, change the query, source, frequency, or delivery method and hit “Update Alert.” To delete, click the trash icon. Gone. You can also unsubscribe from a specific alert by clicking “Unsubscribe” at the bottom of any alert email, which removes that single alert without affecting others.

If you’ve accumulated dozens of alerts over time, audit them quarterly. Delete any that consistently deliver irrelevant results or cover topics you no longer track. Stale alerts just train you to ignore your inbox.

Why Google News Alerts Miss More Than You Think

Google Alerts is a useful starting point. It’s also noticeably limited, and those limitations have gotten more significant as the media landscape has fragmented.

google-news-alert-coverage-vs-blind-spots-comparison
Google Alerts covers indexed web content well but misses social media, AI-generated answers, and sentiment, gaps that widen every year.

Google Alerts only monitors content indexed by Google. It doesn’t track social media posts, podcast mentions, private forums, paywalled articles, or content generated by AI platforms like ChatGPT, Perplexity, or Gemini. For brand monitoring in 2026, that’s a large and growing blind spot.

Coverage is inconsistent. Google Alerts doesn’t catch every matching article, even ones that show up in a manual Google News search. The service has no SLA and no transparency about how it selects results. Some articles appear days late. Others never appear.

No sentiment analysis. You’ll know someone mentioned your brand. You won’t know whether they praised it or criticized it unless you click through and read every result. For teams managing reputation at scale, that manual review burns hours.

No competitive benchmarking. Google Alerts tells you when your brand is mentioned. It can’t tell you how your mention volume compares to competitors, or whether your brand share of conversation is growing or shrinking.

Zero AI search visibility. This is the gap that matters most in 2026. When someone asks ChatGPT or Perplexity “What’s the best project management tool?”, the answer isn’t pulled from Google’s index. It’s generated from training data and real-time sources that Google Alerts can’t see. If your brand is recommended, or missing, from those AI-generated answers, a standard Google alert won’t tell you.

What to Pair With Google Alerts for Full Coverage

The AI-mention layer most teams miss: dedicated tools that track your brand inside ChatGPT, Perplexity, Gemini, and Google AI Overviews responses. Our guide to the best ChatGPT monitoring tools compares 10 platforms across pricing and coverage.

Google Alerts should be one layer of your monitoring stack, not the entire thing. Here’s how to fill the gaps without overcomplicating your workflow.

Social Listening Tools

Platforms like Hootsuite, Sprout Social, and Brandwatch track mentions across Twitter/X, LinkedIn, Instagram, Reddit, and other social channels that Google Alerts ignores completely. If your audience discusses your brand on social media, and they almost certainly do, you need a social media monitoring tool running alongside your Google alerts.

AI Search Monitoring

This is the layer most brands still haven’t built. AI search platforms generate answers from sources that traditional monitoring tools don’t watch. Tracking whether ChatGPT, Gemini, or Perplexity mentions your brand requires specialized tools designed for AI search visibility monitoring.

At BrandMentions, we track AI-generated citations across multiple LLMs to help brands understand where they’re being recommended and where competitors are appearing instead. Google Alerts can’t touch this layer, it wasn’t built for it.

Dedicated Brand Monitoring Platforms

Tools like Mention, dedicated brand monitoring platforms, and Talkwalker Alerts offer faster indexing, broader source coverage, sentiment scoring, and competitive comparisons. They cost more than free, but for any brand where reputation or competitive positioning matters, the investment pays for itself in saved time alone.

Sending Google Alerts to a Work Email

Google Alerts defaults to sending notifications to the Gmail address you’re signed in with. If you need alerts delivered to a work email, you’ve two options.

Option 1: Add your work email as an alternate. Go to your Google Account settings to Personal info to Contact info to Email. Add your work address and verify it. Once verified, it appears as a delivery option when creating or editing alerts.

Option 2: Set up Gmail forwarding. Create a Gmail filter that matches emails from [email protected] and auto-forwards them to your work address. This keeps your alert management in one place while delivering results wherever you need them.

Check your spam folder if verification emails don’t arrive, corporate email filters regularly catch Google’s verification messages.

Google Alerts vs. Google News Alerts: The Difference

People use these terms interchangeably, but they’re not the same thing.

Google Alerts (source: Automatic) scans everything Google indexes, news sites, blogs, forums, web pages, videos, and books. It casts a wide net.

google-alert-source-setting-decision-tree-news-vs-automatic
Your monitoring goal determines the right source setting, most brands benefit from running both a News alert and an Automatic alert for each query.

Google News alerts (source: News) restrict results to publications indexed by Google News. That means editorial news outlets and major publications, not personal blogs, forum threads, or random web pages.

Which should you use? For brand reputation monitoring, start with News as your source. News coverage carries more weight with stakeholders and is more likely to influence public perception. Create a separate alert with “Automatic” source if you also want to catch blog mentions, forum discussions, and other web content. Running both gives you better coverage than either alone.

Fixing Common Google Alert Problems

The hidden cause of most “my alerts stopped working” tickets we see isn’t Google, it’s account drift. A team creates alerts under someone’s personal Google account, that person leaves, and the alerts keep firing to an abandoned inbox for months before anyone notices the stack has gone dark. Create all brand alerts under a shared marketing Gmail or Google Workspace account with at least two reviewers, not a personal account.

Alerts that don’t deliver, deliver junk, or deliver too late, these are the three complaints that come up constantly. Here’s how to fix each one.

Alerts aren’t arriving

First, check that you’re logged into the right Google account at google.com/alerts. If your alert was created under a different account, it won’t show up. Second, check your spam folder, Gmail sometimes filters its own alert emails. Add [email protected] to your contacts to prevent this. Third, verify the alert isn’t paused. The toggle next to each alert on the alerts page shows its active/inactive status.

Results are irrelevant

Your query is too broad. Add quotation marks around multi-word phrases. Add exclusion terms with the minus operator. Switch from “All results” to “Only the best results” temporarily to see if Google’s quality filter helps. If the tool still returns noise, the term itself may be too generic for useful alerting.

Results arrive too late

Switch frequency to “As-it-happens.” Be aware that even this setting isn’t truly real-time, Google batches alerts, and delays of several hours are normal. If you need genuinely fast notifications for crisis monitoring or PR response, Google Alerts alone isn’t built for that speed. You’ll need a dedicated media alert service with faster indexing.

Frequently Asked Questions

Is a Google News alert the same as a Google Alert?

Not exactly. A Google News alert is a Google Alert with the source set to “News.” Google Alerts is the broader tool that can monitor news, blogs, web, video, books, discussions, and finance. When you choose “News” as the source, you narrow results to editorial news publications indexed by Google News.

Can I create a Google News alert without a Gmail account?

You need a Google account, but it doesn’t have to be Gmail. Any Google account, including one created with a work email via Google Workspace, works. Sign in at google.com/alerts and your alerts will be tied to that account.

How many Google Alerts can I create?

You can create up to 1,000 alerts per Google account at no cost. In practice, most individuals use 5, 15 alerts. Brands actively monitoring competitors, executives, and industry terms typically run 20, 50.

Do Google Alerts track social media mentions?

No. Google Alerts only monitors content indexed by Google’s web crawler. It doesn’t track mentions on Twitter/X, LinkedIn, Instagram, TikTok, or Reddit (except for Reddit threads that happen to appear in Google’s web index). For social monitoring, you need a separate social listening tool.

Can Google Alerts tell me if AI chatbots mention my brand?

No. Google Alerts has no visibility into what ChatGPT, Perplexity, Gemini, or other AI platforms say about your brand. These platforms generate answers from training data and real-time retrieval systems that sit outside Google’s index. Monitoring AI-generated brand mentions requires purpose-built tools, something we cover in depth in our guide on checking if AI mentions your brand.

Moving From News Alerts to AI-Layer Coverage

Setting up Google News alerts is a solid first move. It’s free, fast, and gives you a baseline awareness of what’s being published about your brand or industry. Worth doing? Absolutely.

But the information environment in 2026 extends far beyond what Google indexes. AI-generated answers are shaping purchase decisions before buyers ever reach a search engine results page. Prospects are asking ChatGPT for software recommendations. Investors are querying Perplexity about market trends. Your brand is either part of those answers or it isn’t, and no Google alert will tell you which.

Start with Google Alerts for news coverage. Layer in social listening for community conversations. And build visibility monitoring for AI search if you want the full picture of where your brand shows up, and where it’s missing.

If you want to know exactly what AI search engines currently say about your brand, request a quick AI visibility audit. We’ll run 25 category-relevant prompts across ChatGPT, Perplexity, Gemini, and Google AI Overviews so you can see the gap between what Google indexes and what AI is actually surfacing to buyers.

Written by the BrandMentions editorial team. AI-assisted drafting with human editorial review and fact-checking.

Frequently Asked Questions

How do I create a Google News alert in 2026 with the latest settings?

Google Alerts hasn’t changed its core flow in 2026, but source quality and frequency options now matter more. Go to google.com/alerts, enter your search query, select “Sources: News,” set “Frequency: As-it-happens” for breaking news or “Once a day” for digest mode, and choose “Best results” instead of “All results” to filter low-quality content. The 2026 update added stricter spam filtering by default, so legitimate news mentions now arrive faster than they did in 2024.

What free analytics tools track Google brand mentions?

Google Alerts is the baseline free tool: it emails you when your brand name appears in indexed web content, with delivery within 24 hours of indexing. For deeper free analytics, combine Google Alerts with Google Search Console (tracks branded query impressions and rankings) and Google Trends (tracks branded search interest over time). The three together cover 80% of what teams pay for in paid brand monitoring tools. The gap shows up in real-time social mentions and AI search citations, which need dedicated paid tools.

Share of Voice on Social Media: The 5-Channel Calculation

social-share-of-voice-four-variables-anatomy-diagram

This guide covers the modern share of voice strategies 2025 2026 has produced, share of voice tracking tools and methods 2025 2026 teams now adopt, and the best practices share of voice social media monitoring 2025 2026 leaders apply when AI surfaces and traditional channels both factor into reach.

Share of voice on social media is the percentage of total audience conversation your brand captures compared to competitors within a defined market. It tells you whether people are talking about you, or about everyone else. The formula is straightforward: divide your brand’s mentions by the total mentions across all tracked competitors, then multiply by 100. A brand with 300 mentions in a category where all competitors combined generate 3,000 mentions holds a 10% social share of voice.

But the number alone isn’t the point. What matters is the trend, the sentiment behind it, and whether your share is growing in the places that influence buying decisions. In 2026, those places include not just Instagram, LinkedIn, and X, but also AI-generated answers that pull social signals into their recommendations. Your social SOV now feeds visibility far beyond the platforms where conversations happen.

This guide covers how to calculate social share of voice accurately, which tools actually deliver useful data, where most brands miscalculate, and what to do once you’ve a number worth acting on.

What You’ll Learn

  • The exact formula for social share of voice, and the three variables most brands get wrong
  • How social SOV connects to market share growth, with data on excess share of voice
  • Which measurement tools work for different budgets and team sizes
  • Five specific tactics to increase your share of voice on social media without inflating ad spend
  • Why social SOV now influences AI search visibility, and what to do about it

What Social Share of Voice Actually Measures

Social share of voice quantifies how much of the public conversation in your category belongs to your brand. It counts mentions, tags, hashtags, reposts, comments, and organic discussion across social platforms, then compares your total against the combined totals of your competitors.

Social share of voice measures the proportion of audience-generated and brand-generated social conversation that a specific brand owns relative to all competitors in a defined category, time period, and platform set.

Share Of Voice Social Media, social-share-of-voice-four-variables-anatomy-diagram
Social SOV isn’t one number, it shifts based on which competitors, platforms, time windows, and metrics you include in the calculation.

That definition matters because each variable changes the result. Measure across all social platforms and your SOV might look different than it does on LinkedIn alone. Measure over 90 days and you’ll smooth out spikes that a 7-day window would amplify. Choose five direct competitors and your percentage shifts dramatically compared to tracking fifteen.

Most brands treat SOV as a vanity metric, a number for the quarterly deck. It becomes useful only when you control the inputs: which competitors, which platforms, which time window, and whether you’re measuring raw mentions or weighted engagement.

The Social SOV Formula (And Where Brands Miscalculate)

The math is simple. The inputs are where teams make mistakes.

Social Share of Voice = (Your Brand Mentions รท Total Market Mentions) ร— 100

“Total market mentions” means the sum of your brand mentions plus every tracked competitor’s mentions within the same time period and platform set. If you track four competitors and your own brand, the denominator is the combined total across all five.

Mistake 1: counting only @mentions and hashtags

People talk about brands without tagging them. A LinkedIn post saying “We switched from Salesforce to HubSpot last quarter” mentions both brands, neither gets an @tag. Any tool that only captures tagged mentions will undercount every brand in the set, but it’ll undercount some more than others. Brands with strong organic word-of-mouth get hurt most by this blind spot.

Mistake 2: ignoring platform weighting

A mention on LinkedIn carries different weight than a mention on TikTok, depending on your market. B2B SaaS companies measuring social SOV across TikTok, Instagram, and LinkedIn without weighting by audience relevance end up chasing numbers that don’t connect to pipeline. If 80% of your buyers live on LinkedIn, a 15% SOV on LinkedIn matters more than a 40% SOV on Instagram.

Mistake 3: including sentiment-blind totals

A brand crisis generates massive mention volume. Raw SOV would spike, but that’s not share of voice you want. The best measurement approaches layer sentiment on top of volume. A competitor might have 35% of total mentions but 60% of those are negative. Your 20% with 85% positive sentiment is the stronger position. (Yes, this changes the story completely.)

Why Social SOV Predicts Market Share Growth

Share of voice isn’t just a brand health indicator. Research by Binet and Field across 171 campaigns spanning three decades found that brands with excess share of voice, meaning their SOV exceeded their current market share, gained roughly 0.5 percentage points of market share for every 10 points of ESOV. Brands whose SOV fell below their market share tended to shrink.

That research focused on advertising spend as the SOV measure. But the principle holds for social conversation too, and arguably more so now. Paid media reach is capped by budget. Social conversation is capped by relevance.

When your brand owns a disproportionate share of organic social discussion relative to your current market position, it signals that mindshare is moving in your direction before revenue does. SOV is a leading indicator. Market share is the lagging one.

The strategic question isn’t “what’s our SOV?” It’s “is our SOV larger or smaller than our current market share?” Excess share of voice is the gap that predicts growth.

This is where most quarterly reports fall short. They report SOV as a standalone number, 22% this quarter, 24% last quarter. Without anchoring it against market share, the number floats without meaning.

How to Measure Social Share of Voice Step by Step

Getting a reliable SOV number requires deliberate setup before any tool generates a dashboard. Here’s the process that produces data worth acting on.

Step 1: define your competitive set

Pick 4, 6 direct competitors. Not aspirational competitors. Not adjacent categories. The brands your buyers actually evaluate alongside yours. If you sell project management software, your set might be Monday.com, Asana, ClickUp, Notion, and Wrike, not Salesforce or SAP. A tighter set gives you a percentage that reflects real competitive dynamics.

Step 2: choose platforms by buyer behavior

Map where your target buyers spend time and talk about solutions in your category. B2B typically means LinkedIn, X, and YouTube. DTC consumer brands might prioritize Instagram, TikTok, and Reddit. Don’t track platforms where your buyers aren’t active, you’ll dilute the signal.

Step 3: set keyword and mention parameters

Track brand names, common misspellings, product names, branded hashtags, and key employee handles for each competitor. Exclude irrelevant homonyms. “Apple” the tech company needs filters to separate it from apple the fruit. “Monday” the tool needs filters to avoid every casual use of the word.

Step 4: establish your measurement cadence

Weekly snapshots for tactical monitoring. Monthly roll-ups for trend analysis. Quarterly comparisons for strategic decisions. Avoid measuring SOV daily, single viral posts or PR incidents will distort the picture.

Step 5: layer sentiment and engagement weighting

Raw mention counts are your baseline. Then add sentiment classification, positive, negative, neutral, so you know whether your share consists of praise or complaints. If your tool supports it, weight by engagement (likes, reposts, comments) rather than treating every mention equally. A post with 2,000 engagements carries more conversation weight than one with 3.

social-share-of-voice-measurement-layered-process-steps
Each step narrows the data, moving from raw inputs to a sentiment-weighted SOV number you can actually use for decisions.

Tools That Measure Social Share of Voice (Honest Assessment)

Every social listening vendor claims to measure SOV. The difference is in how they handle mention discovery, sentiment accuracy, and competitor benchmarking. Here’s what actually works at different price points.

Tool Best For SOV Capability Limitation
Brandwatch Enterprise teams needing cross-platform depth Automated SOV dashboards with sentiment overlay, competitor panels, historical trending Price starts high; onboarding takes weeks
Sprout Social Mid-market brands wanting listening + publishing in one tool Listening topics with SOV comparison, sentiment classification, share of engagement Competitor tracking limited on lower tiers
Talkwalker PR and comms teams tracking media + social together Multi-channel SOV including news, blogs, forums, and social; AI-powered sentiment UI complexity; takes time to configure well
Mention Small teams and startups needing affordable monitoring Basic SOV by mention volume; competitor comparison dashboard Sentiment accuracy weaker; limited platform coverage
Google Alerts + Manual Tracking Bootstrapped teams or early validation No automated SOV; requires manual spreadsheet calculation No sentiment, no engagement weighting, no real-time data

One opinion worth stating: most brands outgrow manual tracking within the first quarter of trying it. The time cost of manually aggregating mentions across platforms and running competitor comparisons in spreadsheets exceeds the cost of a mid-tier tool by month two. Start with free social listening tools to validate the concept, then invest once you’ve proven the metric matters to your team.

Social SOV vs. Other Share of Voice Channels

Social is one lens. It’s not the only one, and confusing them leads to misallocated budgets.

Media SOV measures your share of press coverage, earned mentions in publications, news outlets, and industry media. It’s about editorial visibility, not conversation volume. A brand with 5% social SOV but 30% media SOV in its category has strong PR but weak community engagement.

SEO SOV measures your organic search visibility across a set of target keywords relative to competitors. Tools like Ahrefs and Semrush calculate this as “visibility score” or “share of SERP.” It tells you who owns the search results page, not who owns the social conversation.

PPC SOV is Google’s impression share metric, the percentage of available ad impressions your campaigns captured. It’s budget-driven and platform-specific.

Social share of voice reflects organic conversation and audience-generated discussion, making it the closest proxy for genuine brand mindshare among the four SOV channels.

The real power shows up when you track all four together. A brand gaining social SOV while losing SEO SOV is usually building buzz but failing to convert that attention into search visibility. The pattern we see across SOV audits is that the brands growing fastest build social and media SOV in tandem, because editorial placements fuel both AI visibility and the social conversations that reference those placements.

For a deeper look at how these channels interact, our breakdown of share of voice vs. share of market covers the relationship between SOV as a leading indicator and market share as the outcome it predicts.

Five Tactics to Increase Social Share of Voice

The social-SOV tactic we see deliver the biggest lift in audits isn’t more posting, it’s more quoting. When you publish one genuinely quotable data point or framework per quarter, the social shares you earn from industry voices referencing it typically move share-of-voice further than six weeks of branded content. Prioritize the one quotable artifact before the content calendar.

Growing social SOV doesn’t require doubling your ad budget. It requires making your brand more talkable, the kind of presence people reference without being prompted.

Build visible points of view on category-defining topics

Brands that generate organic mentions have something to say. Not content for content’s sake, a clear, stated position on where your industry is heading. When a VP of Marketing at a SaaS company posts “We don’t believe in gated content anymore, here’s why,” that generates discussion. When they post “Check out our latest blog,” it doesn’t. Your leadership team’s willingness to take public positions on LinkedIn, X, and industry forums directly increases mention velocity.

Activate employees as distribution channels

Employee advocacy isn’t a nice-to-have anymore. One pattern we’ve observed across campaigns: companies that equip 15+ employees with shareable talking points see 3, 4x the mention volume compared to brands that rely solely on corporate accounts. The math is simple, 20 employees with 500 followers each reach 10,000 people organically. Your corporate account with 5,000 followers reaches maybe 250 after algorithmic filtering.

Create assets designed for reference, not consumption

Some content gets consumed and forgotten. Other content gets referenced. Original research, benchmark data, and proprietary frameworks generate mentions because other people cite them in their own posts. If you publish a “State of [Your Category] 2026” report with original data, every industry commentator who references it creates a mention. That compounds.

Monitor and join competitor conversations

When someone asks “Has anyone used [Competitor]? Looking for alternatives”, that’s an SOV opportunity. Not to pitch aggressively, but to show up with a useful perspective. Brands that monitor competitor mention streams and respond thoughtfully capture mentions that would otherwise default entirely to the competitor. Tools that support brand monitoring on social media make this systematic rather than accidental.

Partner with niche voices, not celebrity influencers

A micro-influencer with 8,000 followers in your exact buyer persona generates more relevant SOV than a macro-influencer with 500,000 followers across mixed audiences. The mention from a respected industry practitioner carries weight because their audience overlaps with yours. The mention from a general-purpose influencer adds volume without relevance, and relevance is what converts SOV into pipeline.

social-share-of-voice-growth-tactics-comparison-matrix
Not all tactics grow SOV equally, reference assets produce slower but higher-quality mentions that compound over time.

The Dark Social Problem (And What You Can Do About It)

A significant share of social conversation happens where no monitoring tool can see it. Slack channels. WhatsApp groups. iMessage threads. Email forwards. Private LinkedIn DMs. This is dark social, and it distorts every SOV calculation.

Research from RadiumOne found that 84% of consumers’ outbound sharing happens through private channels rather than public social feeds. That means the public mentions you’re tracking represent a fraction of actual brand conversation. And there’s no guarantee the fraction is proportional across competitors, brands with stronger word-of-mouth may have higher dark social ratios.

You can’t measure what you can’t see, but you can triangulate. Pair your social SOV data with direct traffic trends in analytics (sudden spikes in direct visits often correlate with dark social sharing), branded search volume changes, and survey-based brand awareness data. None of these are perfect proxies. Together, they help you estimate whether your visible SOV understates or overstates your real position.

Worth acknowledging: this limitation doesn’t make social SOV useless. It makes it incomplete. Every competitor faces the same blind spot. Your relative position, the comparison, still holds value even if the absolute numbers are low.

Social SOV Now Feeds AI Search Visibility

For the AI-visibility side of that feedback loop, see the ChatGPT brand mention check workflow and monitoring brand mentions in LLMs, which walk through how social conversations translate into AI citations platform by platform.

Here’s what changed in 2026 and 2026: social signals now influence how AI search engines represent brands. ChatGPT, Gemini, and Perplexity pull from web-crawled content that includes social discussions, Reddit threads, forum posts, and published social media content. When your brand appears frequently in public social conversations, especially in contexts that associate you with specific capabilities or categories, AI models learn those associations.

This means social share of voice isn’t just a brand health metric anymore. It’s an input to how AI models learn brand-category associations. A brand that dominates social conversation around “enterprise project management” is more likely to surface when someone asks ChatGPT “What’s the best enterprise project management tool?”

The connection isn’t direct, AI models don’t count your mentions and rank you accordingly. But the content that mentions your brand on social platforms gets crawled, indexed, and included in training data or retrieval systems. More high-quality mentions in more relevant contexts build stronger entity associations. And those associations drive AI recommendations.

BrandMentions works with companies to build these associations deliberately, not through inflated social activity, but through strategic placements on high-authority publications that AI models are known to index. Social SOV and editorial citation strategy work in parallel. One builds conversation. The other builds the structured references that AI models weight most heavily.

What to Include in Your Social SOV Report

A useful SOV report doesn’t just show the number. It shows what the number means and what to do next.

The core metric: Your social SOV percentage, measured monthly, compared against the same competitor set. Show the trend line, direction matters more than any single data point.

Competitor breakdown: Individual SOV percentages for each tracked competitor. Identify who’s gaining and who’s losing. A competitor whose SOV jumped 8 points in a month likely launched a campaign, went viral, or had a PR event worth investigating.

Platform-level SOV: Break your total down by platform. You might hold 25% SOV on LinkedIn but only 8% on X. That tells you where to invest, and where to stop wasting effort.

Sentiment overlay: What percentage of your mentions are positive, negative, neutral? A growing SOV with declining sentiment is a warning sign, not a win.

Top mention drivers: Which specific posts, campaigns, or events drove the biggest mention spikes? This connects SOV movement to specific actions your team took, making future planning possible.

ESOV calculation: If you can estimate your market share, calculate excess share of voice. Are you above or below the line? This single data point tells you whether your current trajectory predicts growth or contraction.

For a deeper framework on building these reports, our guide to measuring brand awareness covers how SOV fits within broader awareness tracking.

Measuring share of voice well requires consistent monitoring infrastructure, our overview of social media monitoring services compares the agency models that handle this for B2B teams.

Teams measuring brand presence on social should also track campaign-level performance, see our framework for influencer marketing KPIs that prove real ROI.

Social-channel SOV is one slice of the broader metric. Our complete share of voice guide covers SOV across search, social, and AI surfaces.

Frequently Asked Questions

What is a good share of voice percentage on social media?

There’s no universal benchmark, it depends entirely on your market position and competitive set. A category leader might hold 30, 40% SOV among five tracked competitors, while a challenger brand might target 15, 20% as a growth milestone. The more useful question is whether your SOV exceeds your current market share. If it does, research suggests you’re on a growth trajectory. If it doesn’t, you’re likely losing ground.

How often should I measure social share of voice?

Monthly is the sweet spot for most brands. Weekly monitoring helps you catch spikes from campaigns or competitor activity, but weekly SOV percentages fluctuate too much for strategic decisions. Monthly gives you a stable trend line. Quarterly is too slow, by the time you spot a decline, you’ve lost three months.

Can I measure social SOV without paying for tools?

Technically, yes. You can search each competitor’s brand name across platforms, count mentions manually, and build a spreadsheet. In practice, this breaks down after the first attempt. Manual counting misses misspellings, untagged mentions, and cross-platform data. Even free tools like Google Alerts capture only a fraction. If you’re serious about tracking SOV, budget for at least a mid-tier social listening tool within your first quarter.

Does negative mention volume count toward share of voice?

By default, yes, raw SOV counts all mentions regardless of sentiment. That’s why pure volume-based SOV can mislead. Imagine a competitor goes through a data breach. Their mentions spike. Their raw SOV jumps. But none of that attention is beneficial. The solution is to track two versions: raw SOV (all mentions) and positive SOV (only positive and neutral mentions). The gap between them tells you something important about brand health.

How does social share of voice relate to AI search visibility?

Social conversations create content that AI models can crawl and learn from. When your brand is frequently mentioned in relevant social discussions, especially on indexable platforms like Reddit, LinkedIn public posts, and forums, those mentions contribute to the brand-category associations that AI models build. Higher social SOV in the right contexts increases the probability that AI search engines reference your brand in relevant answers. It’s one input among many, not a direct ranking factor.

Connecting Social SOV to Editorial and AI-Citation Work

Social share of voice is the metric that tells you whether your brand is gaining ground in the conversations that matter, before the revenue data confirms it. But the brands pulling ahead in 2026 aren’t treating social SOV as a standalone metric. They’re connecting social conversation to editorial placements, AI citations, and search visibility in a single compounding system.

Start with the five-step measurement process. Get your baseline. Identify whether you’re above or below the excess share of voice line. Then invest in the tactics that build both social mentions and the structured editorial references AI models rely on.

If you want a baseline before committing to a tool or process, request a quick AI visibility audit. We’ll run 25 category-relevant prompts across ChatGPT, Perplexity, Gemini, and Google AI Overviews so you can see exactly which sources each platform trusts for your category, and which competitors are capturing citations you’re not.

Written by the BrandMentions editorial team. AI tools were used during drafting. Final review, strategy input, and editorial judgment by human editors.

[
,

]

Frequently Asked Questions

How do you calculate share of voice on social media?

Share of voice on social media is calculated as: SOV = (Your Brand Mentions รท Total Industry Mentions) ร— 100. For example, if your brand is mentioned 500 times and the total industry conversation is 5,000 mentions, your social media share of voice is 10%. In 2026, this calculation is expanding to include AI-generated mentions in ChatGPT, Gemini, and Perplexity, not just traditional social platforms.

What tools measure share of voice on social media?

The best social media share of voice tools in 2026 include Brandwatch, Mention, Sprout Social, and BrandMentions. These tools track brand mentions across social platforms, forums, and news sites to calculate your relative share of conversation. For brands that also want to measure share of voice in AI search engines like ChatGPT and Gemini, a dedicated AI visibility and share of voice platform is required.

What is a good share of voice on social media?

A healthy share of voice on social media varies by industry and competitive landscape. In most B2B categories, a share of voice above 20% is strong. Market leaders typically hold 30, 50% SOV in their category. For AI search channels (ChatGPT, Perplexity, Gemini), most brands start near 0%, so even 10% AI share of voice puts you ahead of most competitors in 2026.

Top Brand Tracking Companies Worth Considering

Brand Tracking Companies for AI Visibility in 2026

Brand tracking companies fall into two distinct categories as of 2026: traditional firms that measure consumer perception through surveys and social listening, and a newer class of agencies that monitor how AI search engines reference, recommend, and cite brands. Choosing the right partner depends on whether you need to track what humans think about your brand, what AI platforms say about your brand, or both. This list covers brand tracking research companies (the firms that run quantitative brand health studies), brand tracking research company providers that scale to enterprise, and global brand tracker platforms that combine traditional brand-health work with the new AI search visibility layer.

This distinction matters more now than it did even 18 months ago. According to a 2025 Gartner forecast, traditional search traffic is expected to decline 25% by 2027 as AI-driven answer engines absorb more user queries. That shift means the definition of “brand tracking” itself is expanding, and the companies serving this market are evolving with it.

This article breaks down the brand tracking landscape across both categories, explains what each type of company actually measures, and helps you decide which approach fits your goals in 2026.

Key Takeaways

  • Traditional brand tracking companies measure consumer perception through surveys, social listening, and sentiment analysis, metrics like awareness, consideration, and Net Promoter Score.
  • AI brand tracking companies monitor how large language models and AI search engines mention, recommend, or omit your brand in their responses.
  • The two categories answer fundamentally different questions: “What do people think?” versus “What does AI say?”
  • Most B2B brands in 2026 need both types of tracking to get a complete picture of their market position.
  • Evaluation criteria differ sharply between the two, panel quality matters for traditional trackers, while training data coverage and citation methodology matter for AI trackers.
  • pricing models range from per-response survey fees to annual retainers for AI visibility monitoring.

What Do Brand Tracking Companies Actually Measure?

A brand tracking company is any firm that systematically monitors how a brand is perceived, referenced, or positioned over time. The core purpose is to give you measurable signals about whether your brand-building efforts produce results.

Traditional brand tracking companies focus on human perception. They survey consumers, monitor social media mentions, and analyze sentiment across digital channels. The output is a set of metrics, awareness, consideration, preference, loyalty, that tell you how your target audience feels about your brand relative to competitors.

AI brand tracking companies focus on machine perception. They monitor whether AI platforms like ChatGPT, Perplexity, Gemini, and Google AI Overviews mention your brand when users ask category-relevant questions. The output is a set of citations, recommendation frequency data, and visibility scores that tell you how AI systems position your brand.

ai brand tracking comparison

Both categories are valuable. Neither replaces the other. But understanding the difference prevents you from hiring the wrong type of firm for the problem you need to solve.

Traditional Brand Tracking Companies: Survey and Social Listening Firms

Traditional brand tracking has been the standard for decades. These companies measure how consumers perceive your brand through structured research, primarily surveys, panels, and digital monitoring tools.

How survey-based brand trackers work

Survey-based trackers collect data directly from consumers. They recruit panels, design questionnaires, and run studies at regular intervals, monthly, quarterly, or annually. The goal is to quantify shifts in metrics like unaided awareness, aided awareness, purchase consideration, and brand preference.

Companies in this space include Kantar, YouGov, Qualtrics, Tracksuit, Latana, Attest, and Pollfish. Each offers different levels of self-serve capability, panel size, geographic coverage, and analytical depth.

Kantar, for example, uses its proprietary Meaningful Different Salient (MDS) framework, the only brand equity measurement approach independently validated to predict commercial outcomes, according to Kantar’s published validation research. YouGov tracks over 27,000 US brands daily across 16 core metrics through its BrandIndex tool.

If your primary question is “Do consumers in our target market know we exist, and what do they think of us?”, a survey-based tracker is the right fit.

How social listening and monitoring tools work

Social listening tools track brand mentions across public digital channels: social media platforms, news outlets, forums, review sites, and blogs. They measure volume (how often your brand is mentioned), sentiment (positive, negative, or neutral tone), and share of voice (your mention volume compared to competitors).

Companies in this space include Brandwatch, Meltwater, Brand24, Awario, and Mentionlytics. SEO platforms like Ahrefs and Semrush also offer brand monitoring features that track branded search terms and backlink mentions.

These tools answer a different question than surveys: “What are people saying about us online right now?” They excel at real-time crisis detection, campaign impact measurement, and competitive benchmarking. For a deeper look at the tools available, BrandMentions maintains a breakdown of these tracking platforms across categories.

Strengths and limitations of traditional tracking

Strengths:

  • Decades of validated methodology and established benchmarks
  • Direct consumer input, you hear from real people in your target market
  • Strong at measuring emotional associations, loyalty drivers, and purchase intent
  • Social listening provides real-time alerts on reputation events

Limitations:

  • Surveys capture stated preferences, which may differ from actual behavior
  • Social listening only captures public conversations, it misses private channels and AI-mediated discovery
  • Neither survey data nor social listening data tells you whether AI search engines recommend your brand
  • As AI search grows, a larger share of brand discovery happens outside the channels these tools monitor

AI Brand Tracking Companies: Monitoring What AI Says About You

For the workflows these AI-tracking companies typically operate, see how ChatGPT shows your brand and the Perplexity monitoring playbook, and brand mention tracking inside language models covers the cross-platform cadence that sits above any single vendor.

A newer category of brand tracking company has emerged alongside the rise of AI-powered search. These firms monitor how large language models (LLMs) and AI search engines reference your brand when users ask questions in your category.

This matters because of a behavioral shift. When a VP of Engineering asks ChatGPT “What are the best observability platforms for Kubernetes?”, the brands mentioned in that response get consideration. The brands omitted don’t. And as of 2026, no traditional brand tracking software captures this interaction.

What AI brand tracking measures

AI brand tracking monitors a distinct set of signals:

ai brand tracking funnel
  • Citation frequency: How often AI platforms mention your brand in response to category-relevant queries
  • Recommendation position: Where your brand appears in AI-generated lists or rankings
  • Sentiment and framing: How AI describes your brand, is it positioned as a leader, alternative, or afterthought?
  • Competitor visibility: Which competitors AI platforms recommend instead of you, and in what contexts
  • Platform coverage: Whether your brand appears consistently across ChatGPT, Perplexity, Gemini, Claude, Copilot, and Google AI Overviews, or only on some

Who provides AI brand tracking

This is a younger market. Companies operating in this space focus specifically on AI visibility monitoring and editorial citation building, tracking brand citations across major AI platforms and placing contextual mentions on category-relevant publications that AI retrievers frequently surface.

Other tools in the broader ecosystem focus on specific aspects of AI monitoring. Some SEO platforms have begun adding AI overview tracking features, though most still treat AI visibility as a secondary data point rather than a core capability. For brands that want to understand AI-specific visibility, you can explore how cross-platform brand mention tracking in AI works in practice.

Strengths and limitations of AI brand tracking

Strengths:

  • Captures a discovery channel that traditional tracking misses entirely
  • Measures whether AI platforms treat your brand as an authority in your category
  • Provides actionable data on which competitors AI recommends over you
  • Growing in strategic importance as AI search adoption accelerates

Limitations:

  • The category is newer, methodologies are still maturing and standardizing
  • AI responses vary by query phrasing, model version, and real-time retrieval, results can fluctuate
  • doesn’t replace the need for consumer perception data from surveys or social listening
  • Measuring direct revenue attribution from AI citations remains difficult in 2026

Choosing Between Traditional and AI Brand Tracking

The right choice depends on what question you need answered and where your buyers discover brands.

When traditional brand tracking is the right fit

Choose a traditional brand tracking company if your primary goals include:

  • Measuring consumer awareness and perception in specific demographics or geographies
  • Benchmarking brand health against competitors using established metrics like NPS, aided awareness, or purchase intent
  • Monitoring real-time social media sentiment around product launches or PR events
  • Reporting brand equity metrics to a board or executive team accustomed to traditional KPIs

If your buyers primarily discover brands through traditional search, advertising, word of mouth, and social media, a survey-based or social listening tracker gives you the signals you need.

When AI brand tracking is the right fit

Choose an AI brand tracking company if your primary goals include:

  • Understanding whether AI assistants recommend your brand when users ask category questions
  • Identifying gaps where competitors appear in AI responses and your brand doesn’t
  • Building a strategic plan to increase your brand’s presence in LLM training data
  • Measuring the impact of content and PR investments on AI discoverability

If your buyers use ChatGPT, Perplexity, or Google AI Overviews to research solutions before contacting sales, and especially if you operate in B2B SaaS, fintech, or healthtech, AI brand mentions tracking is increasingly important.

When you need both

Most growth-stage and enterprise B2B brands in 2026 benefit from running both types of tracking in parallel. Consumer perception data tells you how your market feels. AI citation data tells you how AI systems position you within that market.

The two data sets often reveal different stories. A brand can have strong consumer awareness but weak AI visibility, meaning it loses consideration when buyers use AI-assisted research. Conversely, a brand can appear frequently in AI responses but rank poorly on trust or preference in consumer surveys.

ai brand tracking matrix

Combining both gives you a complete picture of how to measure SOV across human and machine channels.

How to Evaluate a Brand Tracking Company

The evaluation mistake we see most often when vendor-shopping is teams accepting a vendor’s aggregate case study numbers without asking to see a live example in their own category. A tracking firm that has beautiful dashboards for consumer goods may fall apart on a B2B SaaS prompt set. Before signing, give the vendor ten of your real buyer prompts and ask them to run the baseline in front of you.

Regardless of category, apply these evaluation criteria before selecting a partner.

For traditional brand tracking firms

  • Panel quality and size: Where do their respondents come from? Are they verified, opted-in panelists or aggregated third-party audiences? Larger panels with demographic diversity produce more reliable data.
  • Methodology transparency: Do they explain how they sample, weight, and validate data? Firms that publish their methodology, like Kantar’s MDS validation or YouGov’s daily tracking protocol, give you more confidence in results.
  • Geographic and industry fit: Some firms specialize in specific markets or verticals. A B2B SaaS brand needs different panel access than a CPG company.
  • Reporting cadence and format: Can you access data in real time, or do you receive quarterly reports? Does the dashboard integrate with your existing tools?
  • Cost structure: Survey-based trackers charge per response, per study, or via annual subscription. Costs range from under $1 per response (Pollfish) to six-figure annual engagements (Kantar, Qualtrics).

For AI brand tracking firms

  • Platform coverage: Does the firm monitor all major AI platforms, ChatGPT, Perplexity, Gemini, Claude, Copilot, and Google AI Overviews, or only one or two?
  • Query methodology: What questions does the firm test against? Do they use category-relevant queries that reflect how your actual buyers ask for recommendations?
  • Citation building capability: Some AI tracking firms only monitor. Others, like BrandMentions, also place editorial mentions on high-authority publications that AI models index, actively working to improve the data they’re tracking.
  • Training data understanding: Does the firm understand when and how AI models update their knowledge? Timing placements to align with training data refresh cycles affects outcomes significantly.
  • Measurement rigor: How do they account for the variability of AI responses across query phrasing, model versions, and retrieval-augmented generation (RAG) windows?

For details on how brand mentions connect to SEO and AI visibility, review how brand mentions work for SEO alongside AI citation strategies.

Pricing Landscape for Brand Tracking in 2026

Budget expectations vary widely depending on the type of company and scope of tracking.

Traditional brand tracking pricing

Company Type Typical Pricing Model Approximate Range
Self-serve survey platforms (Pollfish, Attest) Per response or per study $0.50, $2.00 per response
Mid-market trackers (Tracksuit, Latana, SurveyMonkey) Monthly or annual subscription $20,000, $60,000/year
Enterprise research firms (Kantar, Qualtrics, YouGov) Custom annual contracts $50,000, $250,000+/year
Social listening tools (Brand24, Awario, Mentionlytics) Monthly subscription $49, $499/month
brand tracking pricing chart

AI brand tracking pricing

AI brand tracking is typically priced as an annual retainer or project-based engagement. Costs depend on the number of AI platforms monitored, query volume tested, and whether the engagement includes citation building alongside monitoring.

B2B-specific AI brand tracking, like what Wynter offers for brand perception surveys among B2B audiences, starts around $10,000/year for annual tracking, scaling to $40,000+/year for quarterly monitoring with dedicated analyst support.

Full-service AI visibility and citation agencies tend to price based on placement volume and platform coverage. Check current options through a brand tracking agency comparison to see how providers structure their engagements.

What Has Changed Since 2024, 2025

The brand tracking market shifted meaningfully between 2024 and 2026. Three developments reshaped the landscape:

1. AI search reached mainstream adoption. ChatGPT, Perplexity, and Google AI Overviews moved from experimental tools to everyday research assistants for millions of professionals. According to data published by Similarweb in early 2025, ChatGPT consistently ranked among the top 20 most-visited websites globally. This adoption created genuine demand for AI-specific brand tracking.

2. Traditional trackers began acknowledging the gap. Several established firms, including YouGov and Kantar, started incorporating digital signal monitoring and AI-adjacent analytics into their brand guidance tools. However, as of 2026, most traditional trackers still don’t directly monitor LLM outputs or AI search citations.

3. “Entity authority” became a recognized concept. The idea that AI models develop associations between brands and categories, based on patterns in their training data, moved from niche SEO theory to mainstream marketing discussion. The term entity authority refers to how strongly AI models associate a brand with a specific category, problem, or solution. Building this association through consistent, high-authority editorial mentions is now a recognized growth strategy. You can explore the technical foundation through this primer on entity SEO and its relationship to AI visibility.

Pattern we see in audits: brands with sustained editorial coverage on category-relevant publications show up in AI answers far more reliably than those leaning only on traditional SEO, and the gap widens over time as models keep absorbing those citations on each refresh.

Building a Brand Tracking Stack That Covers Both Channels

Rather than choosing one type of tracking, the most effective approach in 2026 combines three layers:

Layer 1: Consumer perception tracking

Run a survey-based brand tracker at quarterly or semi-annual intervals. Measure aided and unaided awareness, consideration, preference, and brand attribute associations among your target buyers. Self-serve platforms like Attest or Pollfish work well for mid-market brands. Enterprise brands may benefit from Kantar’s or YouGov’s deeper analytical capabilities.

Layer 2: Digital mention monitoring

Use a social listening or brand monitoring tool to track real-time mentions across social media, news, forums, and review sites. This layer catches reputation events, measures campaign impact, and provides competitive share-of-voice data across traditional digital channels.

Layer 3: AI citation tracking

Monitor how AI search platforms reference your brand in response to category queries. Track citation frequency, recommendation position, and competitor visibility across ChatGPT, Perplexity, Gemini, Claude, and Google AI Overviews. If AI platforms aren’t mentioning your brand, the tracking data directly informs a citation-building strategy. For a starting point, see how to check whether AI mentions your brand today.

brand tracking stack infographic

These three layers together provide a complete picture of your brand’s position across human perception, digital conversation, and AI-mediated discovery.

Frequently Asked Questions

What is the difference between brand tracking and brand monitoring?

Brand tracking measures changes in consumer perception over time through structured research like surveys, it answers “How is our brand health trending?” Brand monitoring captures real-time mentions of your brand across digital channels, it answers “What are people saying about us right now?” Most comprehensive strategies use both. Learn more about brand monitoring services and how they complement tracking.

Can traditional brand tracking companies monitor AI search mentions?

As of 2026, most traditional brand tracking firms don’t directly monitor LLM outputs or AI search engine citations. Some have begun incorporating digital signals and search data, but dedicated AI brand tracking requires specialized methodology, specifically, querying AI platforms with category-relevant prompts and analyzing the responses systematically.

How often should you run a brand tracking study?

For consumer perception surveys, quarterly or semi-annual tracking provides enough data to identify trends without excessive cost. For social listening, always-on monitoring is standard. For AI citation tracking, monthly checks are recommended because AI models update their knowledge at varying intervals, and citation patterns can shift between model versions.

Do brand mentions on websites influence what AI recommends?

Yes. Large language models learn brand-category associations from patterns in their training data, which includes content from high-authority websites, news outlets, and editorial publications. Consistent, contextual brand mentions on sources that AI models index strengthen the association between your brand and relevant categories. Research from the Allen Institute for AI published in 2026 confirms that training data composition directly affects model outputs. For more on this mechanism, explore whether brand mentions impact visibility in AI search.

What metrics should a B2B brand track in 2026?

At minimum, track aided and unaided awareness, consideration rate, brand preference, Net Promoter Score, and share of voice through traditional methods. Add AI citation frequency, recommendation position across major AI platforms, and competitor AI visibility as your AI tracking layer. Together, these metrics cover the full spectrum of how buyers discover and evaluate your brand.

Auditing Your Brand Tracking Stack for the AI-Search Gap

The brand tracking landscape has expanded. Traditional survey and social listening firms remain essential for understanding human perception. But a growing share of brand discovery now happens through AI-mediated channels that these firms don’t yet monitor.

The brands gaining competitive advantage in 2026 are the ones tracking both dimensions, what consumers think and what AI platforms say, and using that combined intelligence to guide their marketing investments.

Start by auditing your current tracking setup. If you’re only measuring one side of the equation, you’ve a blind spot. And in a market where AI search adoption continues to accelerate, that blind spot grows larger every quarter.

If you want a baseline before committing to a tool or process, request a quick AI visibility audit. We’ll run 25 category-relevant prompts across ChatGPT, Perplexity, Gemini, and Google AI Overviews so you can see exactly which sources each platform trusts for your category, and which competitors are capturing citations you’re not.

Best Competitor Analysis SEO Tool for Marketers

Competitor Analysis SEO Tool for AI Visibility in 2026

Quick answer: A competitor analysis SEO tool reveals the keywords, backlinks, and content strategies your rivals use to outrank you, so you can close gaps and capture traffic they’re already winning. As of 2026, these tools have evolved far beyond basic keyword tracking. The best options now integrate AI-powered insights, real-time SERP monitoring, and even visibility data across AI search platforms like ChatGPT and Perplexity.

Choosing the right tool matters more than most marketers realize. The wrong one wastes budget on vanity metrics. The right one surfaces specific, actionable opportunities, keyword gaps your competitors exploit, backlink sources you’ve missed, and content angles that drive organic traffic.

This article breaks down how to evaluate competitor analysis SEO tools based on what actually moves rankings in 2026, and where the category is headed as AI search reshapes competitive intelligence.

What You’ll Learn

  • How to evaluate a competitor analysis SEO tool based on data accuracy, coverage, and AI search integration
  • Which tool categories exist and what each one does best, from backlink intelligence to audience research
  • Why AI search visibility data is now a critical factor in competitive analysis
  • How to run a competitor analysis workflow that produces results, not just reports
  • What’s changed in this category since 2024, 2025, including the rise of generative engine optimization (GEO) tracking
  • Where free tools fall short, and when upgrading pays for itself

Why Your Competitor Analysis SEO Tool Needs to Cover More Than Keywords

Traditional competitor analysis focused on three data points: ranking keywords, backlink profiles, and estimated traffic. In 2026, that’s necessary but insufficient.

Competitor Analysis Seo Tool, competitor analysis evolution timeline

AI search engines now drive a meaningful share of discovery and referral traffic. According to a 2025 Gartner forecast, traditional search engine volume was projected to decline 25% by 2026 as users shift toward AI-assisted answers. That shift means your competitors aren’t just competing in Google’s organic results, they’re competing for citations in ChatGPT, Perplexity, Gemini, and AI Overviews.

A competitor analysis SEO tool that only tracks traditional SERP positions misses half the picture. You need visibility into:

  • Keyword gaps, queries your competitors rank for that you don’t
  • Backlink sources, referring domains pointing to competitors but not to you
  • Content performance, which competitor pages generate the most organic traffic and engagement
  • AI search citations, whether competitors appear in AI-generated answers and recommendations
  • Entity authority signals, how well competitors are recognized as category leaders by AI models

The tools that cover all five dimensions give you a strategic advantage. The ones stuck on dimensions one through three leave you flying blind in the fastest-growing search channel.

How to Evaluate a Competitor Analysis SEO Tool in 2026

Not all competitor analysis tools deliver equal value. Before committing to a monthly subscription, assess each option against these criteria.

Data Freshness and Crawl Frequency

Stale data produces stale strategies. The best tools update their keyword and backlink databases weekly or daily. Ahrefs, for instance, operates one of the most active web crawlers globally, Cloudflare’s Radar data consistently places AhrefsBot among the top crawlers by volume. Semrush refreshes its keyword database of over 26 billion keywords on a rolling basis.

Ask two questions before subscribing:

  • How often does the tool update its backlink index?
  • How current is the keyword ranking data, real-time, daily, or weekly?

Depth of Competitive Comparison Features

A tool that shows your competitor’s keyword list is useful. A tool that shows the gap between your keyword portfolio and theirs, filtered by difficulty, search volume, and SERP feature eligibility, is actionable.

Look for dedicated gap analysis features: keyword gap, backlink gap, and content gap tools. These surface specific opportunities instead of drowning you in raw data.

AI Search and Entity Visibility

This is the differentiator in 2026. Tools like Semrush’s AI Visibility Toolkit and SEO Review Tools’ AI Visibility Checker now track whether domains appear in AI-generated results. Competitors appearing in ChatGPT recommendations or Perplexity citations hold an advantage that traditional rank tracking doesn’t capture.

If your competitor analysis SEO tool doesn’t account for entity SEO signals and AI discoverability, you’re analyzing a shrinking portion of the competitive landscape.

Integration and Workflow Fit

The best data is useless if it sits in a dashboard nobody opens. Evaluate how each tool fits into your existing workflow. Does it export to Google Sheets or Looker Studio? Does it integrate with your project management tools? Can you set automated alerts for competitor ranking changes?

ai search evaluation checklist

A tool that fits your workflow gets used. A tool that doesn’t becomes shelfware.

The Core Categories of Competitor Analysis SEO Tools

Competitor analysis tools aren’t interchangeable. They cluster into distinct categories, each solving a different problem. Understanding these categories prevents you from buying a social listening tool when what you actually need is backlink intelligence.

Tool category What it analyzes best Competitive signal it surfaces
Backlink intelligence Referring domains and link profiles pointing to rivals Link sources competitors have earned that you have not
Keyword and SERP tracking Ranking queries and real-time position monitoring Keyword gaps your competitors rank for and you miss
Content performance Which competitor pages drive the most traffic and engagement High-performing content angles worth matching or beating
Audience research Where a competitor’s audience comes from and how it behaves Channels and demand your rivals capture beyond search
AI search visibility (GEO) Citations in ChatGPT, Perplexity, Gemini, and AI Overviews Whether competitors get mentioned in AI answers and you do not

All-in-One SEO Platforms

These tools combine keyword research, backlink analysis, rank tracking, site auditing, and competitive intelligence into a single platform. Semrush and Ahrefs dominate this category.

Semrush stands out for its breadth. Its Keyword Gap tool compares up to five domains simultaneously, showing shared keywords, missing keywords, and unique keyword opportunities. The Traffic & Market Toolkit adds audience demographics, traffic source breakdowns, and market share estimates. As of 2026, Semrush also offers an AI Visibility Toolkit that tracks brand presence across AI search results, a significant competitive advantage for the platform.

Ahrefs leads on backlink intelligence. Its backlink index is one of the largest and most frequently updated. The Competitive Analysis feature identifies content gaps and backlink gaps in a single workflow. Ahrefs is often preferred by SEO specialists who prioritize link-building strategy and content-driven organic growth.

Both tools start at approximately $129, $140/month for entry-level plans. For most B2B marketing teams, one of these two platforms forms the foundation of competitive analysis.

Rank Tracking and SERP Monitoring

Dedicated rank trackers like SE Ranking and Raven Tools focus on monitoring position changes over time. SE Ranking’s SERP Competitors feature shows exactly which domains gained or lost positions on a given day, useful for spotting emerging threats or validating that your SEO efforts are working.

If you already use an all-in-one platform, a dedicated rank tracker may be redundant. But for agencies managing dozens of client campaigns, a purpose-built tool with granular tracking and white-label reporting can be worth the additional investment.

Majestic specializes exclusively in link intelligence. Its proprietary Trust Flow and Citation Flow metrics measure backlink quality and quantity independently, a distinction most all-in-one tools don’t make as cleanly. Majestic’s Topical Trust Flow goes further by measuring how many backlinks come from topically relevant domains, which may influence how search engines interpret your site’s category authority.

For teams whose competitive disadvantage is primarily a backlink gap, Majestic provides depth that general-purpose tools don’t match.

Audience and Market Intelligence

SparkToro approaches competitor analysis from the audience side. Instead of asking “what keywords does my competitor rank for?” it asks “where does my competitor’s audience spend time online?” Enter a competitor’s domain, and SparkToro reveals which publications, podcasts, social accounts, and communities their audience engages with.

This data is especially valuable for content distribution strategy and category visibility share analysis. If your competitor’s audience reads specific industry publications, those publications become strategic targets for brand mentions and thought leadership placements.

SimilarWeb provides a broader market intelligence layer, traffic source breakdowns, audience demographics, and competitive benchmarking across paid and organic channels. It’s more suited for senior marketing leaders evaluating overall competitive positioning than for SEO specialists optimizing individual pages.

Social and Content Performance Analysis

BuzzSumo analyzes which competitor content earns the most social shares, backlinks, and engagement. It’s a content strategy tool disguised as a competitor analysis tool, by showing you what formats, topics, and angles resonate with your shared audience, it directly informs your editorial calendar.

Sprout Social focuses on social media competitor tracking, including sentiment analysis, engagement benchmarking, and share-of-voice measurement across Facebook, Instagram, X, and Pinterest.

Technical SEO Competitor Analysis

Screaming Frog crawls competitor websites to reveal their technical SEO architecture, internal linking patterns, meta tag optimization, heading structures, page speed metrics, and crawl depth. For teams competing in technically complex verticals (e-commerce, publishing, SaaS), understanding how top-ranking competitors structure their sites can surface high-impact optimization opportunities.

seo tools category map

What’s Changed Since 2024, 2025: AI Search Reshapes Competitive Intelligence

The competitor analysis SEO tool category has shifted significantly since 2024. Three changes stand out.

AI Visibility Tracking Is No Longer Optional

in 2026, AI search visibility was a novelty metric. By 2026, it’s a strategic priority. Google’s AI Overviews now appear in a majority of informational queries in the United States. ChatGPT’s integration with web search, Perplexity’s citation-heavy answer format, and Gemini’s expanding role in the Google ecosystem all mean that brand visibility in AI-generated results directly impacts traffic and pipeline.

Semrush responded by launching its AI Visibility Toolkit. SEO Review Tools added an AI Visibility Checker and platform-specific analyzers for ChatGPT, Perplexity, and Gemini. These features let you compare whether your brand or your competitor’s brand appears when users ask AI assistants category-relevant questions.

For B2B brands, this matters because purchase research increasingly starts with AI assistants. A 2025 study by the Allen Institute for AI found that large language models disproportionately cite sources they’ve encountered multiple times across high-authority domains during training. If your competitors have more brand mentions across authoritative publications, they’re more likely to appear in AI recommendations, regardless of your traditional search rankings.

Entity Recognition Drives Competitive Advantage

Entity authority refers to how well AI models recognize and associate a brand with its category. A brand with strong entity authority is more likely to be cited when an AI assistant answers questions about that industry.

This concept barely existed in competitor analysis tools before 2025. Now, understanding whether AI models recognize your brand as a credible entity, and whether they recognize your competitors more strongly, is a measurable competitive dimension.

Tools that track brand mentions in AI responses provide this insight. You can query AI platforms with category-relevant prompts and track which brands appear consistently. Agencies like BrandMentions specialize in building the kind of editorial citation footprint that strengthens entity authority across AI models.

The most effective search rivalry research workflows in 2026 run parallel tracks: one for traditional SERP competition and one for AI search competition. A competitor might rank #1 on Google for a target keyword but be completely absent from ChatGPT’s recommendations for the same topic, or vice versa.

Running both tracks simultaneously reveals opportunities that single-channel analysis misses.

A Practical Competitor Analysis Workflow That Produces Results

Tools are only useful if they feed into a structured workflow. Here’s a process that translates competitive data into action.

Step 1: Identify Your Real Competitors

Your business competitors and your search competitors aren’t always the same companies. A SaaS startup might consider another startup its primary business rival, while its actual SERP competitors are enterprise incumbents and media publications ranking for the same keywords.

Use your all-in-one SEO platform’s competitor discovery feature. In Semrush, the Organic Research to Competitors report shows domains with the highest keyword overlap. In Ahrefs, Competing Domains surfaces the same data. Start with the top five organic competitors by shared keyword volume.

Then run the same exercise in AI search. Query ChatGPT, Perplexity, and Gemini with your most important category questions. Note which brands appear in the responses. These are your AI search competitors, and they may differ from your Google competitors.

Step 2: Run Keyword and Content Gap Analysis

Use the Keyword Gap tool to compare your domain against your top competitors. Filter results to show keywords where competitors rank in the top 10 and you don’t rank at all. Sort by search volume and business relevance.

This produces a prioritized list of content opportunities. Each missing keyword represents a topic your target audience searches for, and finds your competitor instead of you.

For content gap analysis, examine your competitors’ top-performing pages by estimated organic traffic. Identify topics you haven’t covered, angles you haven’t taken, and content formats you haven’t used (comparison pages, calculators, templates).

Use the Backlink Gap feature to find domains that link to your competitors but not to you. Filter by domain authority and topical relevance. These represent your highest-probability link-building targets, if a publication linked to your competitor on a similar topic, they may link to your content too.

Pay special attention to publications that AI models are likely to include in training data. High-authority editorial sites, industry publications, and established news outlets carry weight in both traditional SEO and AI visibility. If competitors have brand mentions and backlinks from these sources, prioritize earning similar coverage.

Step 4: Assess AI Search Visibility

Track which competitors appear in AI-generated results for your target queries. Use tools that monitor AI citations, or run manual queries across ChatGPT, Perplexity, and Gemini on a weekly cadence.

Document the patterns. Which competitors appear most frequently? Which sources do AI platforms cite? What language do AI responses use when recommending brands?

This data informs your AI brand mention strategy. If competitors consistently appear in AI answers because they have editorial mentions on authoritative publications, that’s a signal to invest in strategic brand placement.

Step 5: Build Your Action Plan

Translate findings into a prioritized action plan with three lanes:

seo competitor analysis workflow
  • Content creation, fill keyword and topic gaps with content that’s more helpful and complete than what competitors offer
  • Link and mention building, target the publications and sources where competitors have coverage and you don’t
  • AI visibility, build entity authority through consistent editorial mentions on publications that AI models reference during training

Revisit your competitive analysis quarterly. Search landscapes shift. New competitors emerge. Algorithm updates change the playing field. Ongoing monitoring, not one-time analysis, is what produces compound results.

Where Free Competitor Analysis Tools Fall Short

The competitor-tool mistake we see most often in audits is a team that stacks three free tools and mistakes overlap for completeness. Each free tool shows the same keyword list, and the team ships a report that reads like a dashboard tour instead of a decision. The paid layer almost always needs to be narrow, not broad, and it should cover the one or two data gaps the free tools can’t fill for your category.

Free tools exist across most competitor analysis categories. Google Search Console shows your own keyword performance. Google Alerts tracks competitor mentions. Free tiers of Semrush, Ahrefs, and Ubersuggest provide limited keyword and backlink data.

For early-stage businesses or individual SEO practitioners, free tools provide a starting point. But they have consistent limitations:

  • Data caps, free plans restrict the number of queries, tracked keywords, or exported results per day
  • Limited competitor comparison, most free tiers let you analyze one domain at a time, not compare multiple competitors side by side
  • No historical data, free tools rarely provide trend data or historical ranking positions, making it hard to identify patterns
  • No AI visibility tracking, as of 2026, AI search visibility features are exclusively available on paid plans or specialized tools

The inflection point comes when your business depends on search-driven revenue. At that stage, the cost of a paid tool, $130, $300/month for most platforms, is far less than the cost of missed opportunities that a free tool can’t surface.

Pro Insight: If budget is tight, start with one all-in-one platform (Semrush or Ahrefs) and supplement with free tools for specific tasks. This covers 80% of competitor analysis needs at a single subscription cost.

How AI Visibility Data Changes the Competitive Equation

For the per-platform walkthroughs behind the AI side of this competitive view, see checking brand mentions in ChatGPT and how to track brand mentions in Perplexity, and tracking your brand across LLMs covers the cross-platform cadence that pairs with the SEO-side competitor work described below.

The most significant shift in competitor analysis as of 2026 isn’t a new tool feature, it’s a new dimension of competition entirely.

When a prospect asks ChatGPT “What’s the best project management tool for remote teams?” and your competitor appears in the response but you don’t, that’s a competitive loss no traditional rank tracker captures. The same applies to Perplexity citations, Gemini recommendations, and Google AI Overview mentions.

The pattern we see in competitive audits is that brands with sustained editorial coverage on category-relevant publications appear in AI recommendations far more reliably than those leaning on traditional SEO alone. That gap is widening as AI search adoption accelerates, and a competitor analysis tool that ignores it understates where the market actually is.

Understanding this dimension changes how you interpret competitive data:

  • A competitor with lower Domain Authority but frequent AI citations may capture more qualified traffic than you expect
  • A competitor with strong backlinks but no editorial brand mentions may be vulnerable in AI search, even if they outrank you in Google
  • Brand tracking now requires monitoring both traditional search positions and AI platform responses

The tools that integrate both dimensions, traditional SERP competition and AI search competition, provide the most complete competitive picture. Those that don’t leave a growing blind spot in your strategy.

Matching the Right Tool to Your Situation

Your optimal tool stack depends on your team size, budget, competitive intensity, and which search channels drive your revenue.

For Startups and Small Marketing Teams

Start with one all-in-one platform. Ahrefs Lite ($129/month) or Semrush Pro ($139.95/month) covers keyword research, backlink analysis, rank tracking, and basic competitor comparison. Supplement with SparkToro’s free tier for audience insights and manual AI search monitoring.

For Mid-Market B2B Companies

Use an all-in-one platform at a mid-tier plan for expanded data limits and competitor comparison features. Add Semrush’s AI Visibility Toolkit or an equivalent AI monitoring tool. Consider Majestic for deep backlink intelligence if link-building is a primary growth lever.

Invest in brand monitoring platforms compared to track competitor mentions across editorial publications, social media, and AI platforms.

For Enterprise Marketing Teams and Agencies

Enterprise teams typically run multiple tools simultaneously: an all-in-one SEO platform, dedicated social listening (Sprout Social or Talkwalker), market intelligence (SimilarWeb), and AI visibility monitoring. The key at this level is integration, ensuring data from multiple tools feeds into unified reporting and decision-making.

b2b seo tools comparison

Agencies managing client campaigns benefit from platforms with white-label reporting, like SE Ranking or Raven Tools, alongside Semrush or Ahrefs for primary research.

The Role of Brand Mentions in Competitive SEO Strategy

One dimension of competitor analysis that traditional tools underreport is brand mention frequency and quality. Brand mentions, instances where a company name appears in editorial content on authoritative websites, influence both traditional search rankings and AI visibility.

Google has long acknowledged that unlinked brand mentions serve as implicit endorsement signals. AI models take this further: LLMs learn brand-category associations from their training data, which consists largely of web content from high-authority publications. A brand mentioned frequently in editorial contexts related to its category builds stronger entity associations than a brand mentioned only on its own website.

When analyzing competitors, track where they earn mentions:

  • Which industry publications feature them?
  • Are they cited in comparison articles, expert roundups, or product reviews?
  • Do their mentions appear on sites that AI models are likely to include in training data?

Tools like brand mention trackers and brand awareness measurement tools surface this data. A specialist builds citation footprints across category-relevant publications AI retrievers frequently surface, which strengthens the kind of entity authority that drives AI recommendations.

If your competitors have a more strong editorial citation footprint than you do, that’s a competitive gap worth closing, and it won’t show up in a standard keyword gap report.

Frequently Asked Questions

What is the best competitor analysis SEO tool for beginners?

Semrush and Ahrefs both offer structured competitor analysis workflows accessible to beginners. Semrush’s Domain Overview provides a single-dashboard comparison of up to five competitors with metrics like authority score, organic traffic, and keyword overlap. Ahrefs’ Competitive Analysis tool walks users through keyword and backlink gap identification step by step. Either platform works well as a first tool.

Can free competitor analysis tools provide useful data?

Free tools like Google Search Console, Ubersuggest’s free tier, and Google Alerts provide basic competitive intelligence. They work for initial research and narrow-scope analysis. However, they lack the depth, comparison features, and AI visibility tracking that paid tools offer. For businesses where organic search drives revenue, paid tools typically pay for themselves through the opportunities they surface.

How often should you run a competitor analysis?

Run a comprehensive competitor analysis quarterly to catch strategic shifts, new entrants, and ranking changes. Set up ongoing monitoring, automated rank tracking, backlink alerts, and AI visibility checks, on a weekly or bi-weekly cadence. Markets move faster in 2026 than they did two years ago, especially as AI search results update more frequently than traditional indexes.

Do competitor analysis SEO tools track AI search results?

Some do. Semrush’s AI Visibility Toolkit, SEO Review Tools’ AI Visibility Checker, and dedicated brand monitoring platforms now track whether domains appear in AI-generated answers across ChatGPT, Perplexity, Gemini, and Google AI Overviews. As of 2026, this capability is still emerging, not every platform offers it, and methodologies vary. Prioritize tools that provide this data if AI search is a meaningful traffic channel for your industry.

How do brand mentions affect competitive SEO performance?

Brand mentions on authoritative publications influence both traditional search signals and AI citation behavior. Search engines treat editorial mentions as implicit trust indicators. AI models learn brand-category associations from training data, brands mentioned frequently alongside relevant topics build stronger entity authority. Tracking competitor brand mentions reveals a dimension of competitive advantage that keyword and backlink data alone don’t capture. Learn more about how brand mentions impact AI search visibility.

Running the Two-Front Competitive Audit on a 30-Day Cadence

The competitor analysis SEO tool you choose in 2026 needs to serve two fronts: traditional search competition and AI search competition. Tools that only address the first front leave you exposed to a channel that’s growing faster than any other in digital marketing.

Start with a strong all-in-one platform for keyword, backlink, and content gap analysis. Layer in AI visibility monitoring to track which competitors appear in AI-generated recommendations. And don’t overlook the editorial brand mention dimension, it’s the connective tissue between traditional authority signals and AI citation behavior.

The brands that gain ground in 2026 won’t just track competitors, they’ll act on what they find across both traditional and AI search channels. That’s the difference between competitive analysis as a report and competitive analysis as a growth engine.

If you want a baseline before committing to a tool or process, request a quick AI visibility audit. We’ll run 25 category-relevant prompts across ChatGPT, Perplexity, Gemini, and Google AI Overviews so you can see exactly which sources each platform trusts for your category, and which competitors are capturing citations you’re not.