
Marketers often talk about share of voice and share of market as if they are interchangeable, but they measure very different parts of performance. Share of voice measures your brand’s visibility or attention compared with competitors, while share of market measures your brand’s sales or revenue share of the category. One tells you how loud you are. The other tells you how much you sell. They sit at different points in the funnel, and reading one as the other is how teams misjudge whether a campaign is actually working. This comparison walks through what each metric measures, how they are calculated, how they behave over time, and which one to reach for in a given decision.
What Share of Voice vs Share of Market Actually Measures
Share of voice is your share of category attention. Share of market is your share of category sales. That single contrast is the whole article in one line, and everything below it is detail.
Both metrics get confused for a fair reason. Both are “share” numbers, both are calculated against your competitors, and both rise and fall with how you spend. But they answer different questions. Visibility can precede revenue. Sales confirm whether that visibility ever turned into demand you captured.
In most marketing dashboards, the two metrics answer different executive questions: are we being seen, and are we winning business? When a brand earns a wave of coverage but its revenue share stays flat, share of voice and share of market are quietly telling you two different stories at once. You need both to read the situation correctly.

If you want the foundation before the comparison, our explainer on what share of voice means and how to measure it covers the metric in isolation. This piece keeps both metrics in frame at once.
The Comparison Criteria That Matter
A metric is only useful if its data source matches the decision you need to make. Before contrasting the two, fix the lenses you will judge them by. These six criteria run through every section that follows.
- What each metric measures
- How each is calculated
- Where the data comes from
- Whether it leads or lags real demand
- Which channels it applies to
- What business question it answers
Share of voice definitions vary widely across social, search, public relations, and paid media, because each channel measures a different slice of attention. Share of market is usually more standardized, because it ties back to sales or revenue data that the finance team already owns.
A strategist’s note worth keeping: many teams pick a share of voice tool before defining the business question. That order produces a dashboard full of numbers nobody can act on. Decide what you are trying to learn first, then choose the metric and the data source that answer it.
Definitions and Formulas Side by Side
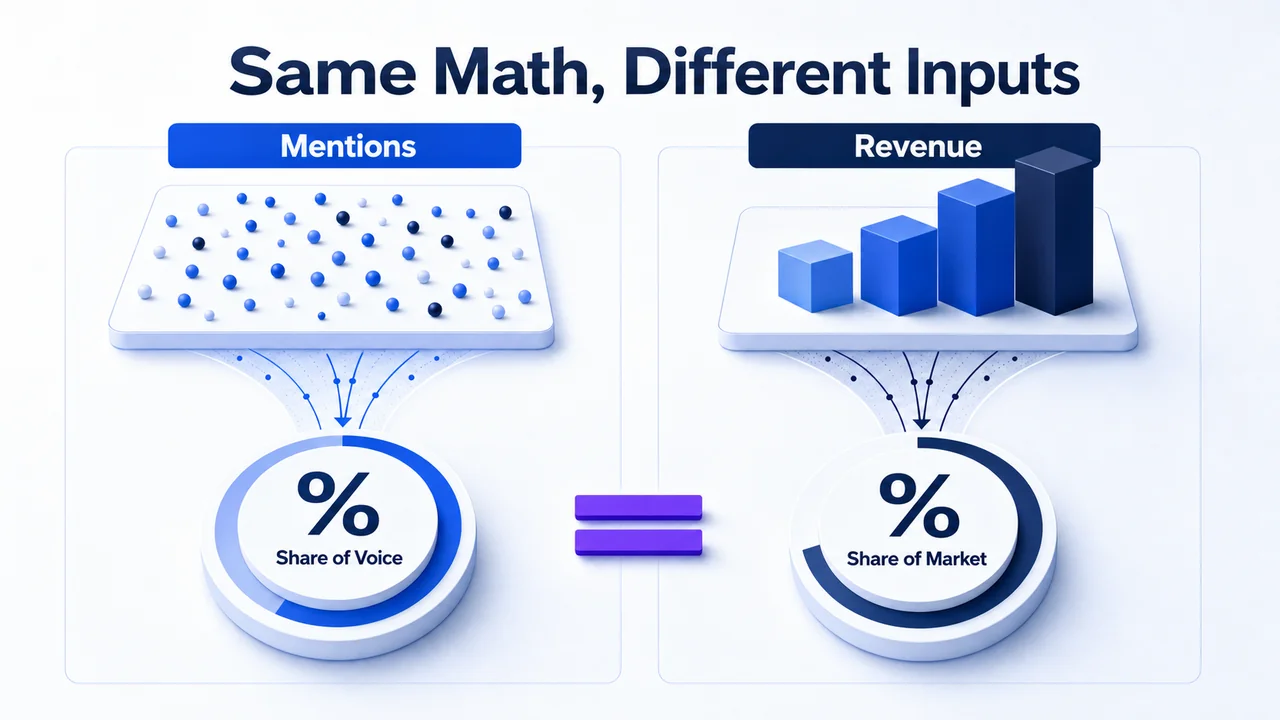
The math behind both metrics is nearly identical. The inputs are where they diverge.
What Share of Voice Means
Share of voice is a brand’s share of category attention: its portion of mentions, impressions, conversation, or visibility within a defined channel or market. It answers how present you are relative to competitors in the spaces where buyers form opinions, from social feeds to search results to earned media.
What Share of Market Means
Share of market is a brand’s share of total category sales, revenue, or unit volume. It answers how much of the actual buying you captured. It is the commercial outcome, not the attention that may or may not have led to it.
| Attribute | Share of Voice | Share of Market |
|---|---|---|
| What it measures | Visibility or attention share | Sales or revenue share |
| Formula | Brand mentions or impressions ÷ total category mentions or impressions × 100 | Brand sales or revenue ÷ total category sales or revenue × 100 |
| Primary input | Mentions, impressions, coverage, search visibility | Revenue, unit volume, sales |
| What the result tells you | How seen you are vs rivals | How much of the buying you won |
Here is the contrast in one example. If a brand earns 200 of 1,000 category mentions, its share of voice is 20%. If that same brand drives $2M of $10M in category revenue, its share of market is also 20%. Same math, completely different business meaning. The first says you own a fifth of the conversation. The second says you own a fifth of the money.
How the Metrics Are Measured in Real Marketing Teams
The operational gap between the two is bigger than the formula gap. Visibility data is scattered and noisy. Sales data is centralized and clean.
Share of voice gets pulled from many places. Social mentions come from social listening platforms. Earned coverage comes from media monitoring. Search visibility comes from rank and keyword tools. Paid impression share comes from ad platforms like Google Ads. Each source measures a different form of attention, which is exactly why two tools rarely report the same share of voice number for the same brand.
| Data need | Share of Voice source | Share of Market source |
|---|---|---|
| Social conversation | Social listening tools | Not applicable |
| Earned media | PR and news monitoring | Not applicable |
| Search presence | Rank trackers, keyword tools | Not applicable |
| Paid visibility | Ad platform impression share | Not applicable |
| Commercial outcome | Not applicable | Internal revenue, unit volume, category estimates |
Share of market is simpler to source but harder to complete. Your own sales sit in the finance system. The category total usually does not, so you combine internal numbers with market research, industry reports, or category estimates to size the denominator.
Share of voice almost always needs normalization before the number means anything: a fixed competitor set, a defined keyword or mention set, a consistent time window, a single geography, and a clear channel selection. Skip that step and the same brand can look dominant on one tool and invisible on another. If you are setting this up across more than one platform, our guide to measuring share of voice across every channel covers how to align those definitions so the numbers stay comparable.
How Share of Voice and Share of Market Behave Over Time
Share of voice tends to move first. Share of market tends to follow, if everything else holds.
Share of voice often acts as a leading indicator because visibility can rise before revenue shows up. You run a campaign, mentions climb, search interest builds, and the sales effect arrives later. Share of market is a lagging indicator. It reflects the result after demand, distribution, and conversion have already played out.
This is where excess share of voice enters carefully. When your share of voice sits higher than your share of market, you may have room to grow into that attention. When it sits lower, a competitor is being heard more than you in a market you currently lead on sales, which is a warning worth acting on.
The relationship is directional, not automatic. Pricing, distribution, creative quality, seasonality, and category maturity can all break the pattern. Teams routinely see share of voice climb during a campaign while share of market stays flat, because the message, the offer, or the channel mix was not actually working. Visibility is the signal. It is not the proof.
Where Each Metric Fits in Marketing Strategy
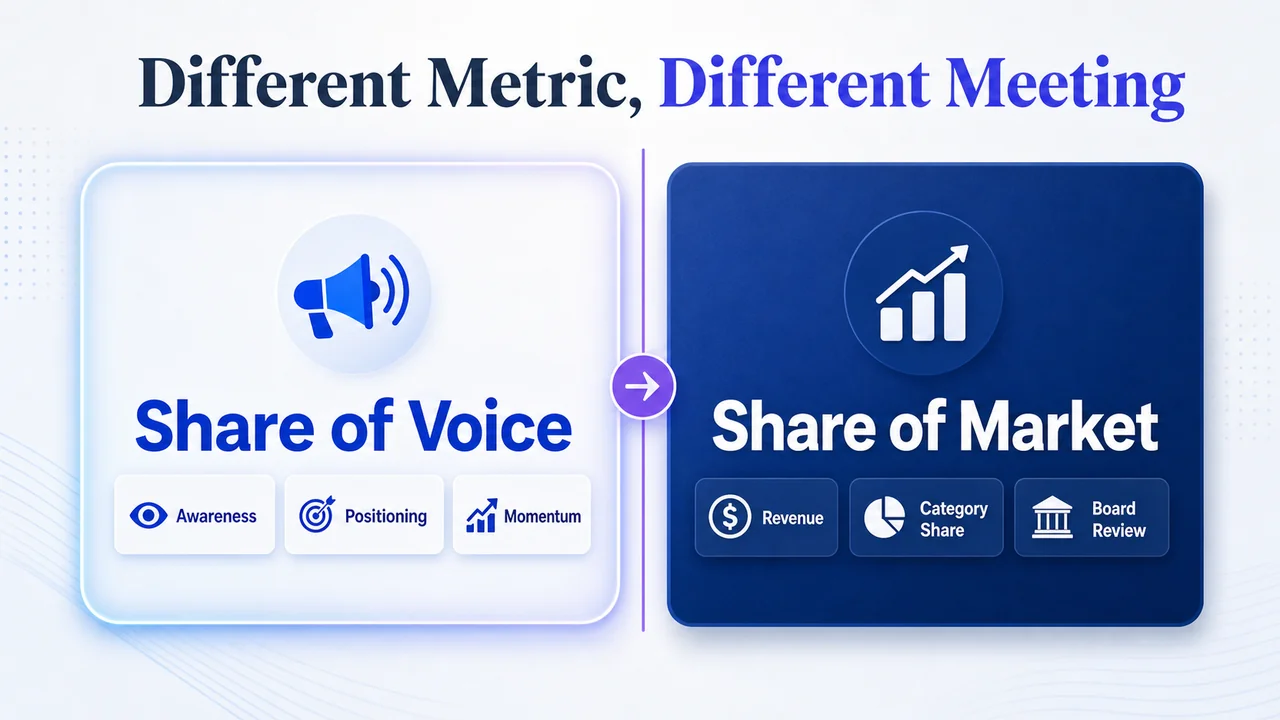
Each metric answers a different question, so the right one depends on the meeting you are walking into.
Share of voice answers: are we visible enough compared with competitors? It earns its place in awareness work, share-building, campaign tracking, competitive positioning, and reading brand momentum. Share of market answers: are we converting that visibility into actual business? It belongs in commercial planning, category-leadership reviews, revenue accountability, and board-level performance reporting.
| Use case | Reach for |
|---|---|
| Brand awareness | Share of Voice |
| Competitive positioning | Share of Voice |
| Campaign monitoring | Share of Voice |
| Revenue accountability | Share of Market |
| Category leadership review | Share of Market |
| Executive performance reporting | Share of Market |
Modern share of voice rarely lives in one channel. It can span search, social, public relations, paid media, and even creator ecosystems, which is why the definition has to be pinned down before the number is trusted. Share of market stays anchored to financial outcomes no matter how many channels feed the attention. Brand and demand teams usually need both metrics, just not in the same meeting or for the same audience. Brand-momentum work often pairs naturally with the metrics that predict pipeline rather than with a pure revenue report.
Strengths, Limitations, and How the Two Relate
Neither metric is complete on its own. Each is strong where the other is blind.
Strengths of Share of Voice
Share of voice is strong for early signal tracking, competitor comparison, and channel-level visibility. It moves fast, it is sensitive to campaigns, and it shows momentum before the revenue line confirms anything. For a challenger building presence, it is often the first place growth becomes visible.
Limitations of Share of Voice
Share of voice can be noisy, channel-specific, and inflated by low-quality mentions or vanity coverage. A spike in mentions from a controversy is not the same as a spike in buying interest. Without normalization and quality weighting, the number flatters or misleads.
Strengths of Share of Market
Share of market is strong for business accountability and category benchmarking. It is hard to argue with, because it is tied to revenue that actually arrived. When you need to prove commercial position, this is the metric that holds up in a board meeting.
Limitations of Share of Market
Share of market lags changes in brand momentum and can miss upstream brand-building effects entirely. A brand investing heavily in awareness today may show no share-of-market movement for months, which makes the metric a poor early-warning system on its own.
How They Relate
Read together, the gap between them is the insight. Share of voice above share of market suggests growth potential you have not yet realized. Share of voice below share of market suggests underinvestment, weak visibility, or a competitor gaining ground you will feel later. Do not read share of voice as proof of future growth by itself. It becomes useful when you pair it with category size, spend levels, and conversion data.

Which Metric Should You Prioritize by Scenario
The strongest teams do not ask which metric is better. They ask which metric answers this decision fastest.
| Scenario | Prioritize | Why |
|---|---|---|
| Brand building | Share of Voice | Visibility moves before sales |
| Launch planning | Share of Voice | No sales history to read yet |
| Campaign monitoring | Share of Voice | Fast feedback on attention |
| Reputation management | Share of Voice | Tracks conversation in real time |
| Executive reporting | Share of Market | Revenue is the accountable number |
| Revenue planning | Share of Market | Tied to commercial outcome |
| Category-share accountability | Share of Market | Measures actual position won |
| Performance marketing | Both | SOV for impression capture, SOM for downstream impact |
| Category leadership defense | Both | Protect visibility and sales together |
For category leaders, protecting both matters at once. A leader that lets share of voice slip while sales hold steady is funding its own future decline, because a louder challenger is building the awareness that converts later. For challengers, share of voice is especially useful early, when you are building momentum before share gains become visible in the revenue line. Reading either number well also depends on a disciplined competitor set, which is why solid competitor analysis done right sits underneath both metrics.
Use Both, but Never Read One as the Other
Share of voice measures attention. Share of market measures sales. They are complementary, not interchangeable, and the gap between them is often more telling than either number alone. Use share of voice to understand visibility and momentum, use share of market to understand commercial outcome, and watch the relationship between them to judge whether your visibility is turning into market power. Measure share of voice and market share together, and you can see whether attention is actually becoming growth. See how to set up reliable share of voice measurement so the visibility side of that picture holds up.
Why the Gap Between the Two Predicts Growth
Research across 171 campaigns found that a brand whose share of voice exceeds its share of market by 10% typically gains about 0.5% market share over time — meaning the SOV-to-SOM gap isn’t just a reporting curiosity, it’s a leading indicator. Brands trying to close that gap fastest usually do it through earned mention volume, since it moves faster than the paid-media weight required to shift advertising SOV alone.
Frequently Asked Questions
What is the difference between share of voice and share of market?
Share of voice measures your brand’s visibility or attention compared with competitors, while share of market measures your brand’s share of actual category sales or revenue. One captures how present you are in the conversation. The other captures how much of the buying you won. They use nearly identical math but completely different inputs.
Is share of voice the same as market share?
No. Market share is the same thing as share of market, a sales or revenue measure. Share of voice is a visibility measure. A brand can hold a high share of voice while holding a low share of market, which usually signals it is being heard more than it is being bought, at least for now.
Does higher share of voice always lead to higher market share?
No, the link is directional rather than automatic. Higher share of voice often precedes market-share growth, but pricing, distribution, creative quality, seasonality, and competitive response can all break the pattern. Visibility creates the opportunity to grow. It does not guarantee the sale.
How do you calculate share of voice?
Divide your brand’s mentions or impressions by the total category mentions or impressions, then multiply by 100. The harder part is defining the inputs: a fixed competitor set, a consistent keyword or mention set, a single time window, and one geography. If a brand earns 200 of 1,000 category mentions, its share of voice is 20%.
What is excess share of voice?
Excess share of voice is the gap between your share of voice and your share of market. A positive gap, where share of voice sits above share of market, is often read as growth potential, since attention is running ahead of sales. A negative gap can signal underinvestment or a competitor gaining ground you will feel in revenue later.