
Most brands track the wrong influencer marketing KPIs. They screenshot likes, celebrate follower spikes, and report engagement rates that never connect to a single dollar of revenue. Then the CFO asks, “What did we get for that $50K?”, and the room goes quiet.
Influencer marketing KPIs are the specific metrics you use to measure whether an influencer campaign delivered against its objective, whether that’s awareness, traffic, conversions, or long-term brand equity. The right KPIs change based on what you’re trying to achieve. A brand awareness campaign measured by cost per acquisition will always look like a failure. A conversion campaign measured by reach will always look like a success, until someone checks the P&L.
The fix isn’t tracking more metrics. It’s choosing fewer, sharper ones that map directly to business outcomes. This piece breaks down exactly which KPIs to track by campaign goal, how to set benchmarks that aren’t fiction, and where attribution breaks down in ways most guides never mention.
Key Takeaways
- Pick 2-3 primary KPIs per campaign based on your funnel stage, not a generic checklist of 20 metrics.
- Cost per acquisition (CPA), return on ad spend (ROAS), and customer lifetime value (LTV) are the KPIs that justify budgets to leadership.
- Engagement rate alone is misleading without context, platform, influencer tier, and content format all shift what “good” looks like.
- Attribution is the hard part. UTMs and promo codes cover the basics, but they miss the 60-70% of conversions that happen outside the click path.
- Brand mentions and share of voice are the KPIs most teams ignore, and they’re the ones that compound over time, especially in AI search.
Why Most Influencer KPI Frameworks Fail
The standard advice is to track everything: reach, impressions, engagement rate, click-through rate, conversions, EMV, sentiment, saves, shares, video completion rate, and audience growth. That’s not a measurement framework. That’s a data dump.
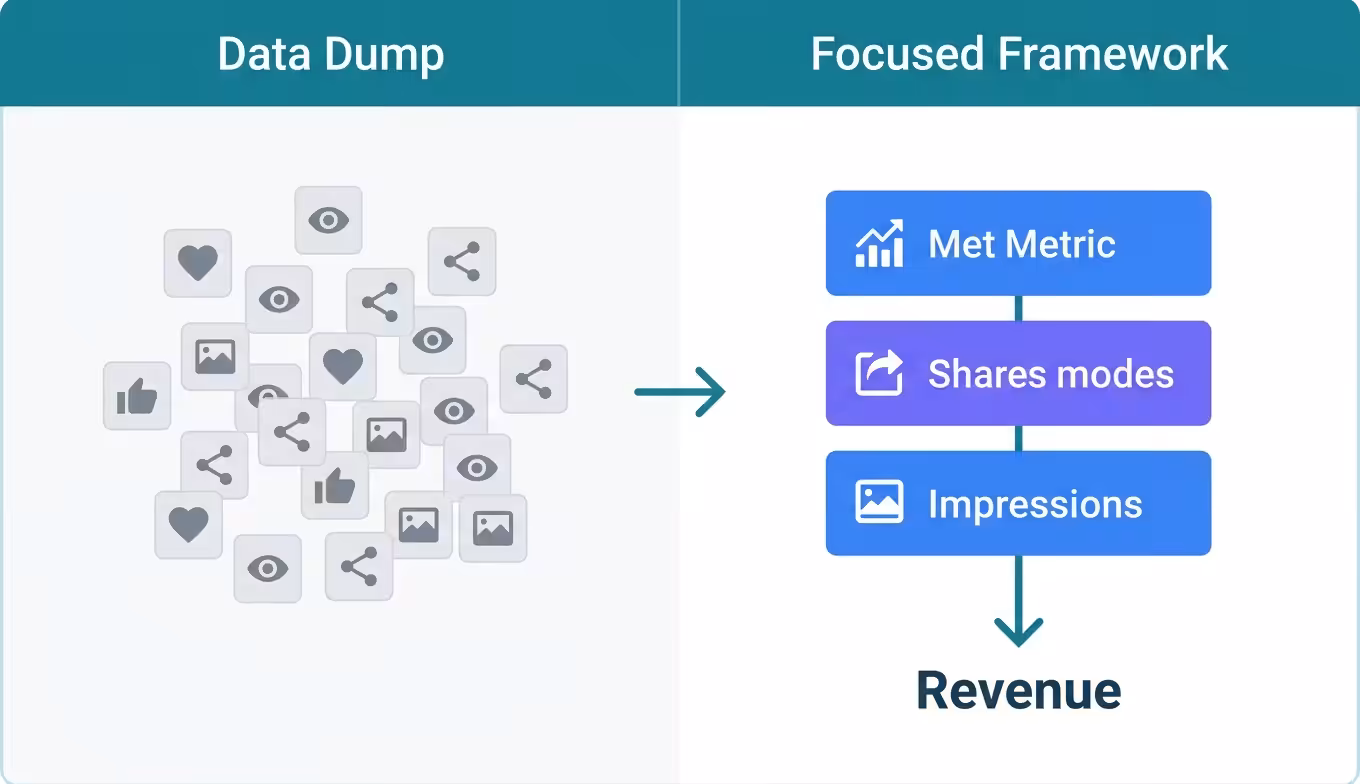
The problem is structural. When you track 15 KPIs, you’ll always find one that looks good. That makes it easy to justify the campaign internally, and impossible to actually learn what worked. Teams end up optimizing for metrics that flatter the report rather than metrics that grow the business.
A better approach: start with the business outcome you need, then work backward to the 2-3 metrics that directly indicate whether you’re getting there. Everything else is context. Useful, maybe. Primary KPI? No.
Matching KPIs to Campaign Goals
An influencer campaign without a defined goal isn’t a campaign, it’s sponsorship. The goal dictates the KPIs. Not the other way around.
Here’s how the mapping works across four common objectives:
| Campaign Goal | Primary KPIs | Supporting Metrics |
|---|---|---|
| Brand Awareness | Reach, brand mentions, share of voice | Impressions, video view completion rate, hashtag volume |
| Engagement | Engagement rate (by reach), saves, shares | Comment sentiment, story interactions, content saves |
| Traffic & Leads | Click-through rate (CTR), cost per click (CPC), lead volume | Landing page bounce rate, time on site, email sign-ups |
| Revenue & Conversions | CPA, ROAS, conversion rate | Promo code redemptions, average order value (AOV), LTV |
Notice what’s missing from the primary column: follower count. Impressions. Likes. These aren’t bad data points, they’re just not decision-driving ones. They belong in the “context” layer, not the “did this work?” layer.
Awareness Campaigns
Your primary KPI is reach, the number of unique people who saw the content. Not impressions (which count repeat views), not follower count (which counts people who might see it). Reach tells you how many new eyeballs actually landed on your brand.
But reach alone is shallow. Pair it with brand mentions and share of voice to measure whether the campaign generated conversation beyond the influencer’s own post. Did people start talking about you? Did media pick it up? Did the brand name start appearing in organic discussions?
Share of voice measures the percentage of total brand-related conversations in your category that mention your brand, and it’s one of the strongest predictors of future market share growth. If your influencer campaigns aren’t moving share of voice, they’re generating attention without building position.
In campaigns we’ve tracked across B2B and DTC brands, the ones that invested in awareness KPIs alongside share of voice tracking on social media were far better at connecting influencer spend to pipeline growth three to six months downstream.
Conversion Campaigns
If the goal is revenue, your primary KPI is CPA or ROAS. Full stop.
CPA tells you what you paid to acquire each customer through the campaign. ROAS tells you how much revenue you generated per dollar spent. Together, they answer the only question leadership cares about: was this profitable?
Supporting metrics matter here too. Conversion rate tells you whether the influencer drove the right traffic (high intent) or just high volume. AOV tells you whether those customers spent more or less than your average. And promo code redemption rate gives you a clean, directly attributable signal, no UTM guesswork required.
One thing most guides skip: promo codes undercount. According to impact.com’s 2026 influencer benchmark data, roughly 32% of consumers who buy after seeing a sponsored post don’t use the code. They search the brand name directly, visit the site later, or buy in-store. Your promo code data captures the floor of performance, not the ceiling.
The KPIs That Actually Justify Budgets
Engagement rates don’t get budgets approved. Revenue metrics do. If you want influencer marketing to grow inside your organization, you need to speak the language your CFO already uses.
Cost Per Acquisition (CPA)
CPA = total campaign cost ÷ number of conversions attributed to the campaign. Simple formula, complicated reality.
The “complicated” part is attribution. A customer who sees an influencer’s TikTok, Googles your brand two days later, clicks a retargeting ad, and then converts, who gets credit? Last-click attribution gives it to the retargeting ad. The influencer, who created the initial demand, gets nothing.
This is why influencer CPA almost always looks worse than it actually is. The channel creates demand. Other channels capture it. If you measure influencer CPA in a silo, you’ll undervalue it every time.
Return on Ad Spend (ROAS)
ROAS = revenue from campaign ÷ campaign cost. A ROAS of 5:1 means you earned $5 for every $1 spent.
The Influencer Marketing Hub 2026 benchmark report found that the average influencer marketing ROI sits at $5.78 per $1 spent, with top-performing campaigns reaching $18, $20 per $1. But those top-tier results typically come from campaigns with strong attribution systems, not just better influencers.
If your ROAS calculation only counts promo code sales, you’re reporting maybe 30-40% of real impact. Layer in post-purchase surveys (“How did you hear about us?”) and branded search lift to get closer to reality.
Customer Lifetime Value (LTV)
This is the metric most influencer measurement guides ignore, and it’s the one that changes the entire calculation.
An influencer-acquired customer with a $200 first order but $1,200 LTV is worth six times more than what your CPA calculation suggests. If influencer-sourced customers have meaningfully higher LTV than paid-social-sourced customers (and multiple DTC brands have reported exactly that), the true ROI of influencer marketing is being systematically underreported.
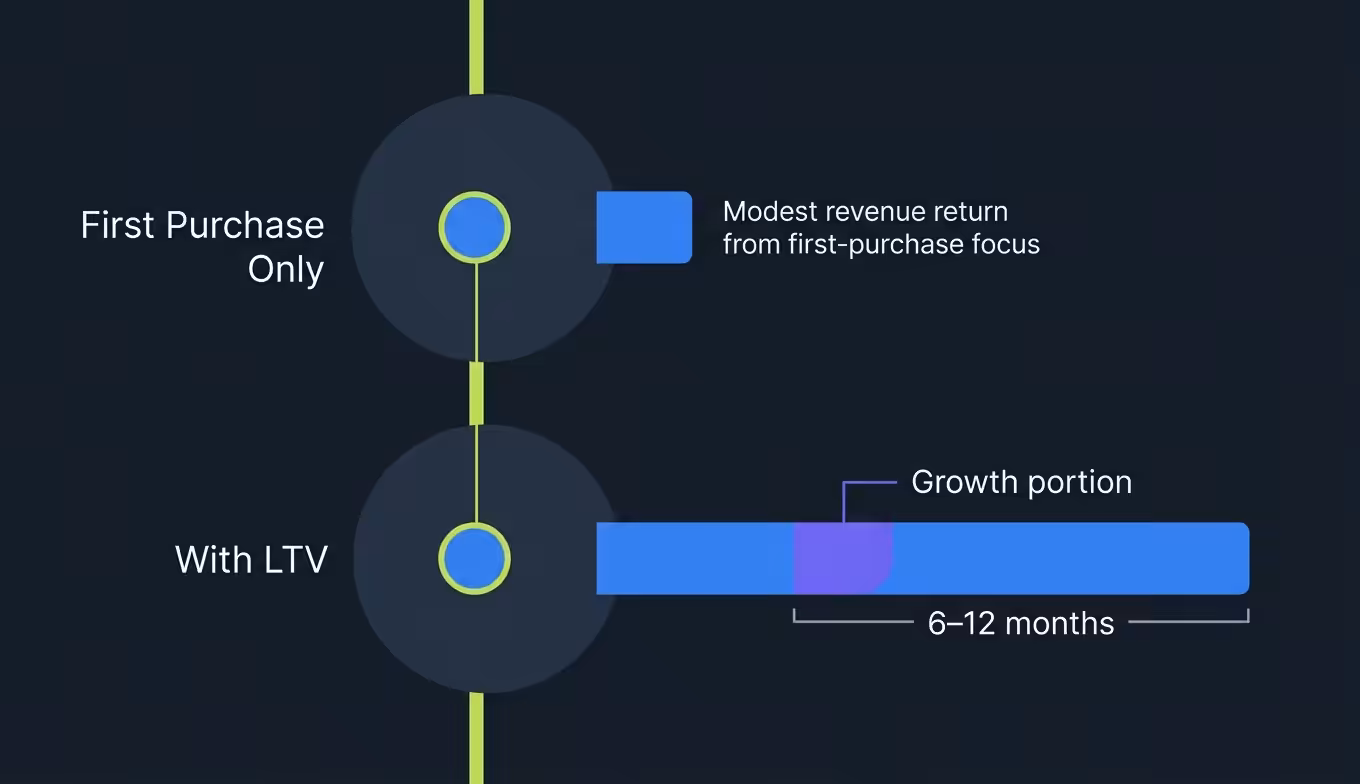
Track LTV by acquisition channel. It takes 6-12 months of data to get reliable numbers, but it’s the single strongest argument you can bring to a budget conversation.
Engagement Rate: Useful, but Only With Context
Engagement rate is the metric everyone defaults to. And it can be useful, when you know what you’re comparing.
The formula most platforms use: (likes + comments + shares) ÷ total followers × 100. The problem is this formula rewards small audiences. A nano-influencer with 3,000 followers and 300 engagements has a 10% engagement rate. A macro-influencer with 500,000 followers and 10,000 engagements has a 2% rate, but drove 33x more total engagement.
Which one performed better? Depends entirely on your goal.
If you’re running a conversion campaign, you want total engagement volume from a targeted audience. If you’re testing creative concepts, you want engagement rate from a niche community. The number alone tells you almost nothing without the context of platform, influencer tier, content format, and campaign objective.
A few benchmarks worth knowing: TikTok nano-influencer engagement rates average around 10%, while Instagram nano-influencers sit closer to 1.7%. Comparing across platforms without adjusting for these baselines will lead you to bad decisions fast.
Saves and Shares Over Likes
If you’re going to track engagement, weight saves and shares higher than likes. A like takes half a second. A save means “I want to come back to this.” A share means “This is worth my social capital to recommend.” These are the engagement signals that correlate with purchase intent, and the ones most reporting dashboards bury.
Brand Mentions and Share of Voice: The Compounding KPIs
For the per-platform walkthroughs that make the mentions KPI measurable, see verifying ChatGPT cites your brand and running a Perplexity brand check, and monitoring how LLMs reference your brand covers the cross-platform cadence that pairs with the KPI framework described below.
Here’s where most influencer KPI guides stop too early. They cover reach, engagement, and conversions, the metrics you can measure in the first 72 hours. But influencer marketing also produces long-tail effects that compound over weeks and months.
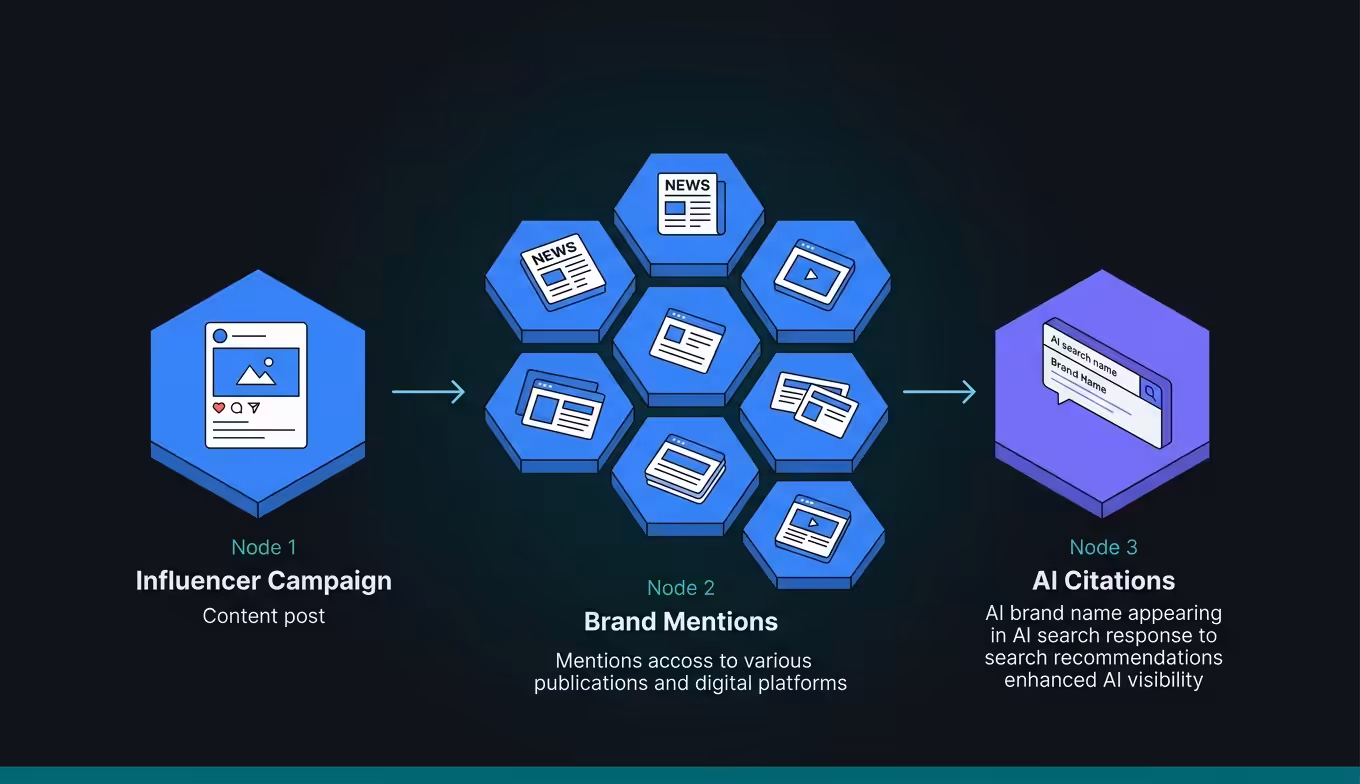
Brand mentions, every instance where your brand name appears in earned content, comments, reviews, forums, or media coverage, are the residue of a good influencer campaign. They persist after the sponsored post drops out of the feed. And they influence surfaces that most marketers aren’t even measuring yet.
In AI search specifically, brand mentions across high-authority publications influence whether AI models like ChatGPT, Gemini, and Perplexity recommend your brand in response to category queries. An influencer campaign that generates editorial pickups and third-party mentions is building brand citations that AI models learn from, whether or not that was the original intent.
The pattern we see in influencer-KPI audits is that brands which track mentions as a first-class KPI alongside reach and engagement consistently outperform on AI visibility six months later. Campaigns that ignored mentions entirely tend to see citation rates stay flat, regardless of how strong the engagement numbers looked at the time.
Share of voice is the next level. It measures what percentage of category conversations mention your brand versus competitors. If your influencer program increased share of voice from 12% to 19% over a quarter, that’s a measurable gain in category authority, even if direct conversions from the campaign were modest.
For teams already tracking share of voice, our share of voice breakdown covers the calculation methods and tools that work best for influencer-generated data.
How to Set Benchmarks That Aren’t Fiction
A KPI without a benchmark is just a number. “We got 45,000 impressions” means nothing until you know whether 45,000 is excellent, average, or embarrassing for your category, influencer tier, and spend level.
Most brands set benchmarks by Googling “average influencer engagement rate” and copying whatever the first result says. That gives you a generic number from an unknown mix of industries, platforms, influencer sizes, and campaign types. It’s barely better than guessing.
Better approach:
1. Use Your Own Historical Data First
If you’ve run 3+ influencer campaigns, your past performance is the most relevant benchmark you’ve. Beat your own average.
2. Segment by Variables That Actually Matter
Platform, influencer tier (nano/micro/macro/mega), content format (static, video, story, reel), and campaign type (gifted, paid, affiliate). A benchmark that blends all of these together is useless.
3. Ask Your Influencer Partners
Experienced creators know their typical performance ranges. A creator who tells you “my Reels average 3.2% engagement and 1.1% CTR on swipe-ups” is giving you a more accurate benchmark than any industry report.
4. Set Floor and Ceiling Targets
“We need at least 2:1 ROAS to break even, and we’re targeting 5:1” is infinitely more useful than “we want good ROI.”
Where Attribution Breaks Down
The attribution mistake we see most often in influencer-KPI audits is a team trusting last-click tracking for creator campaigns and writing off everything that didn’t convert in the same session. The creator drove the discovery, the branded search two weeks later closed the sale, and the dashboard credits direct traffic. Layer a branded-search lift window and a coupon or creator-specific URL over the raw analytics before drawing conclusions about which creators underperformed.
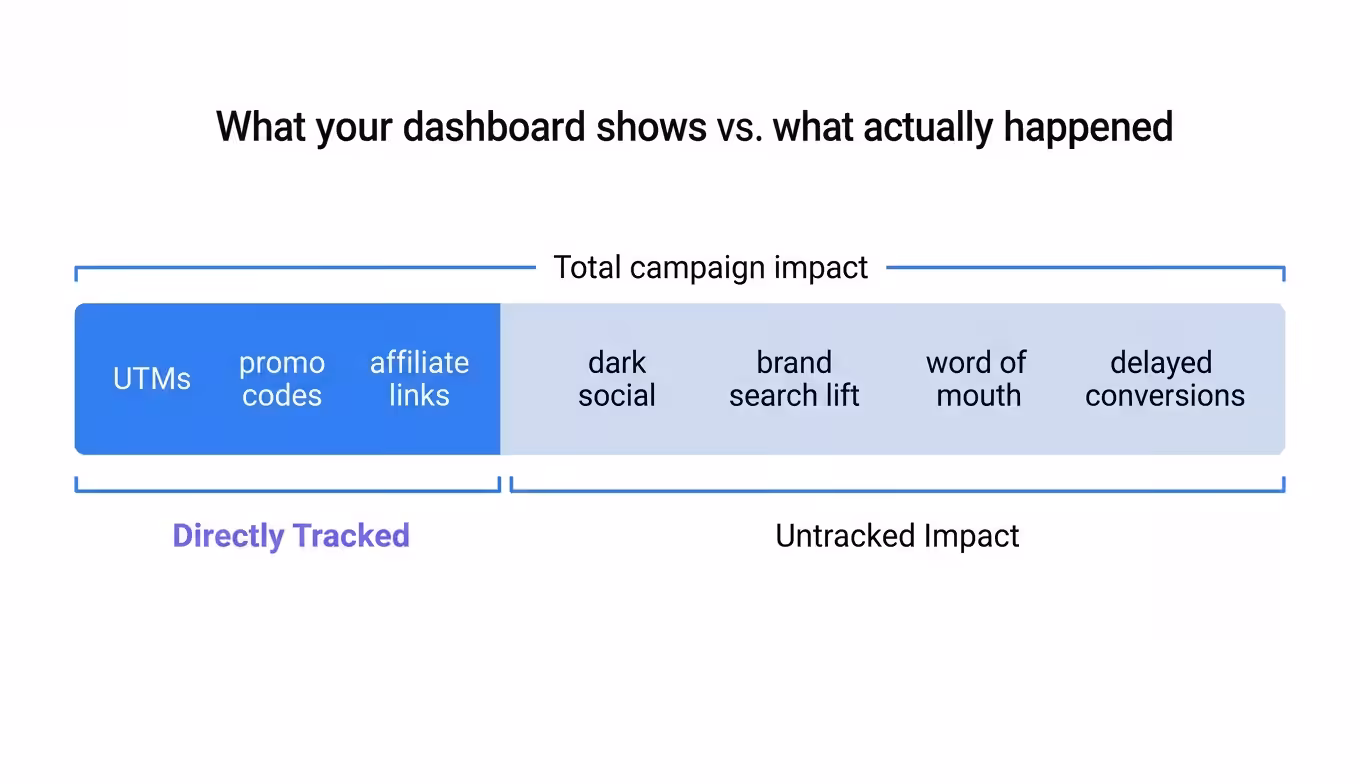
Attribution is the elephant in every influencer marketing measurement conversation. The data you can track directly, UTM clicks, promo code redemptions, affiliate link conversions, captures only a fraction of the real impact.
The rest happens in ways your analytics tools can’t see. Someone watches an influencer’s story, screenshots the product, sends it to a friend on iMessage, and the friend buys three days later from a Google search. That conversion will never trace back to the influencer. Dark social, brand search lift, word-of-mouth amplification, these are all real revenue drivers that vanish from your dashboard.
This doesn’t mean attribution is pointless. It means you need multiple signals, not one:
- UTM parameters on every link. Non-negotiable baseline.
- Unique promo codes per influencer. Captures direct intent.
- Post-purchase surveys asking “How did you first hear about us?” Captures the untrackable.
- Branded search volume lift during and after campaigns. If branded searches spike 30% during an influencer push, that’s causal evidence, even without a click trail.
- Brand mention volume tracking across web, social, and AI surfaces. If mentions jump 40% in the week after a campaign, the influencer drove earned conversation, and that has downstream value you can quantify.
The brands getting influencer measurement right in 2026 aren’t relying on any single attribution method. They’re triangulating across direct tracking, survey data, and brand signals to build a more complete picture. (Yes, it’s more work. But it’s also the difference between “influencer marketing doesn’t work” and “influencer marketing drives 22% of new customer acquisition when measured properly.”)
Earned Media Value: Handle With Care
Earned media value (EMV) is one of the most commonly cited influencer KPIs, and one of the most easily abused.
The basic formula: total impressions × CPM rate = EMV. The idea is to translate organic influencer content into an equivalent paid media cost. If an influencer post generated 500,000 impressions and your paid CPM is $12, the EMV is $6,000.
The appeal is obvious. EMV gives you a dollar figure to put in a slide deck. But here’s the problem: there’s no standardized CPM rate. Different tools use different baselines, and the number can swing wildly depending on which CPM you plug in. An EMV of $50,000 from one platform might be $18,000 on another, for the same campaign.
Use EMV as a directional signal, not a hard metric. It’s helpful for comparing relative performance across campaigns you’ve run (as long as you use the same formula each time). It’s unreliable for justifying spend to anyone who asks, “How did you calculate that?”
Building a KPI Dashboard That Leadership Actually Reads
The best measurement system is worthless if the report lands as a 40-row spreadsheet that no one opens after the first meeting.
Keep your influencer report to one page. Three sections:
- Headline outcome: Did the campaign hit its primary KPI? CPA was $X (target was $Y). ROAS was Z:1. Brand mention volume increased X%. One line. Clear answer.
- Supporting context: 3-5 supporting metrics that explain why the headline number is what it’s. Engagement rate, reach, CTR, conversion rate. Brief. No more than a table.
- What we’ll change next time: One to two tactical adjustments based on the data. “Creator A drove 4x the conversions of Creator B at half the CPE, we’ll shift budget toward micro-influencers in similar niches.” This is what separates reporting from learning.
If you’re running multiple influencer campaigns simultaneously, tools that monitor brand mentions across platforms can feed directly into the awareness layer of your dashboard, giving you a real-time view of earned conversation alongside your direct-response metrics.
Related guides
Frequently Asked Questions
What are the most important KPIs for influencer marketing?
The most important KPIs depend on your campaign goal. For revenue campaigns, track CPA, ROAS, and conversion rate. For awareness campaigns, track reach, brand mentions, and share of voice. Pick 2-3 primary KPIs per campaign, not 15.
How do you calculate influencer marketing ROI?
ROI = (revenue from campaign − campaign cost) ÷ campaign cost × 100. If you spent $10,000 and generated $58,000 in attributable revenue, your ROI is 480%. The challenge is attribution, promo codes and UTMs capture direct conversions, but post-purchase surveys and branded search lift fill in the gaps from dark social and delayed purchases.
What is a good engagement rate for influencer content?
It depends on platform and influencer size. On TikTok, nano-influencers average around 10% engagement. On Instagram, nano-influencers sit closer to 1.7%. Comparing a TikTok creator to an Instagram creator without adjusting for platform norms will mislead you every time. Use your own historical campaign data as the most reliable benchmark.
Should I track earned media value (EMV)?
Use it as a directional comparison tool, not a hard ROI metric. EMV calculations vary dramatically depending on which CPM rate you use, and there’s no industry standard. If you track EMV, keep the formula consistent across campaigns so you can at least compare relative performance. Never present it as actual revenue.
How do brand mentions connect to influencer marketing KPIs?
Brand mentions measure earned conversation, every instance where your brand name appears in content, comments, reviews, or media beyond the influencer’s own post. They indicate whether a campaign generated word-of-mouth that persists after the paid content ends. Brands that track mentions as an influencer KPI also gain visibility into how those mentions influence AI search recommendations over time.
Using the KPI Dashboard to Plan Next Quarter’s Influencer Slate
Measurement without action is just record-keeping. The point of tracking influencer marketing KPIs isn’t to know what happened, it’s to know what to do next.
If CPA is too high, you either have the wrong influencers, the wrong audience, or the wrong offer. If engagement is strong but conversions are flat, the creative resonates but the landing page or CTA isn’t closing. If brand mentions spiked during the campaign but dropped immediately after, you generated attention without building lasting authority.
Every KPI is a diagnostic. The metric tells you something moved. Your job is to figure out why, and whether it moves the business forward.
The brands that win at influencer marketing in 2026 aren’t the ones with the biggest budgets or the most famous creators. They’re the ones who measure with precision, learn from each campaign, and compound those learnings over time. That’s how you turn influencer spend from a line item into a growth engine.
If you want a baseline before committing to a tool or process, request a quick AI visibility audit. We’ll run 25 category-relevant prompts across ChatGPT, Perplexity, Gemini, and Google AI Overviews so you can see exactly which sources each platform trusts for your category, and which competitors are capturing citations you’re not.
Written by the BrandMentions team, AI visibility strategists who track brand citations across 250+ publications and every major AI search platform.
This article was produced with AI assistance and reviewed by a human editor for accuracy, voice, and editorial quality.
[ , ]