Pricing
Request a Free Audit

AI Visibility for Enterprise Software: 2026 Playbook

ai-visibility-enterprise-software-signal-layers

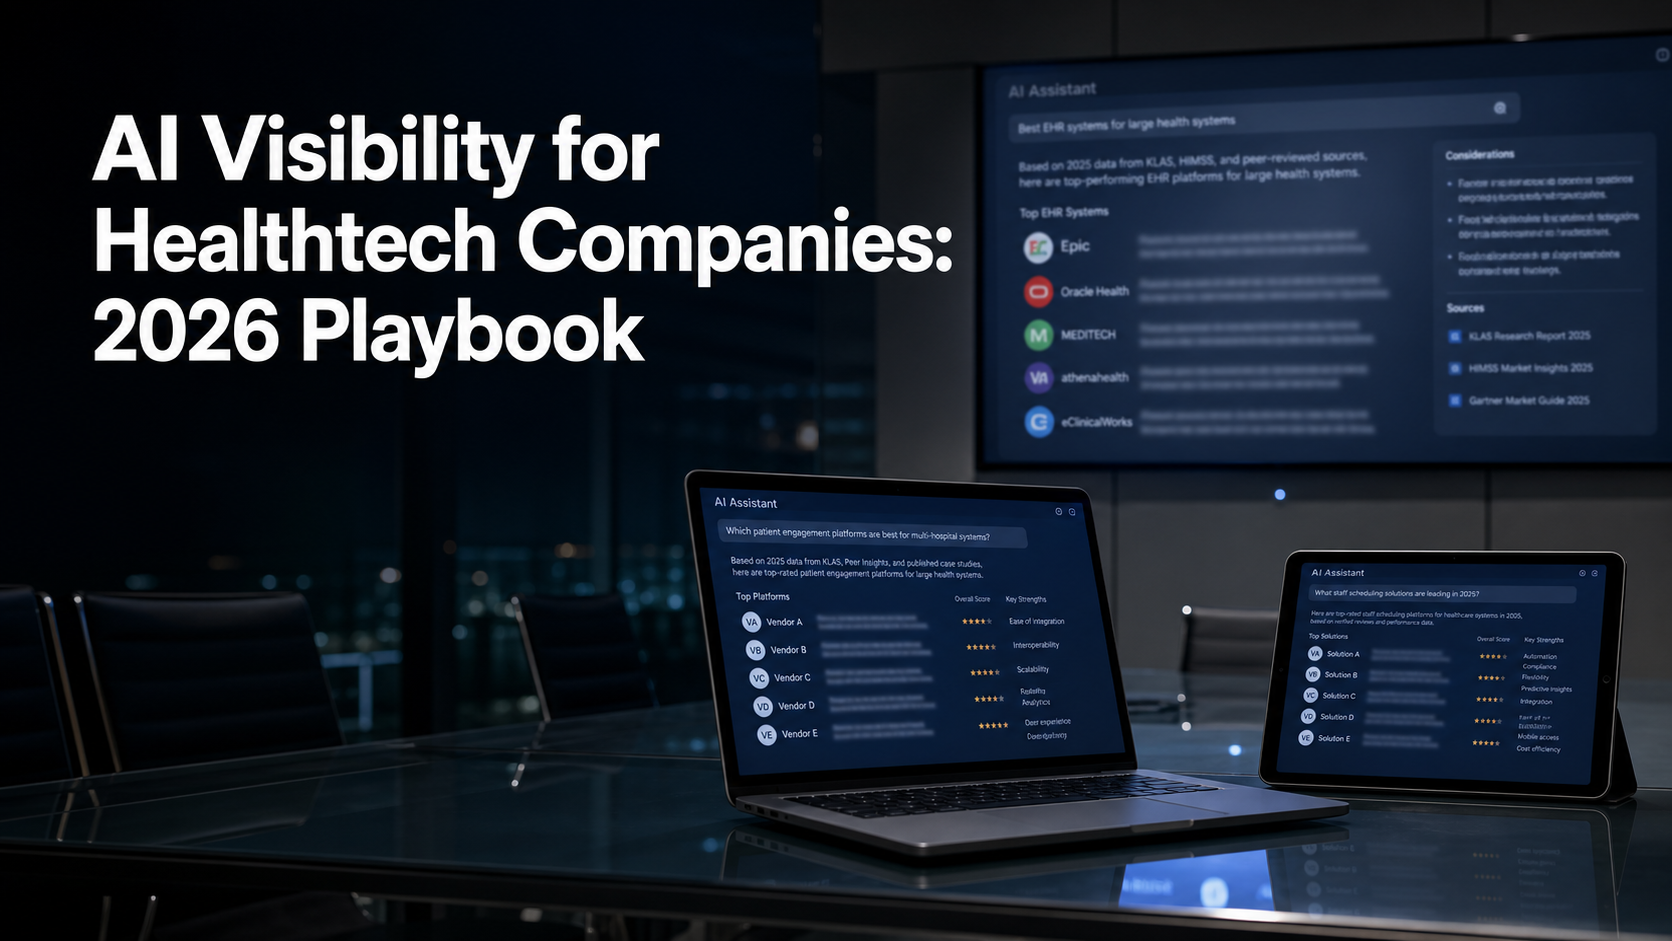
Enterprise software buyers stopped trusting vendor websites years ago. In 2026, they ask ChatGPT, Perplexity, and Gemini before they ever talk to sales, and the brands those models recommend already won the deal before the RFP went out. If your $200K ACV product isn’t in the consideration set when a Fortune 1000 buyer types “best enterprise data observability platform,” you’re not losing on price or features. You’re losing on visibility. AI visibility for enterprise software is the discipline of ensuring large language models cite your product as a credible option when buyers research solutions in your category. It’s harder than B2B SaaS visibility because procurement, security, and compliance signals factor heavily into how AI models weigh enterprise vendors, and most companies have built none of them in a way machines can read.

What You’ll Learn

  • Why enterprise software has a unique AI visibility problem, and what makes it different from B2B SaaS or DevTools
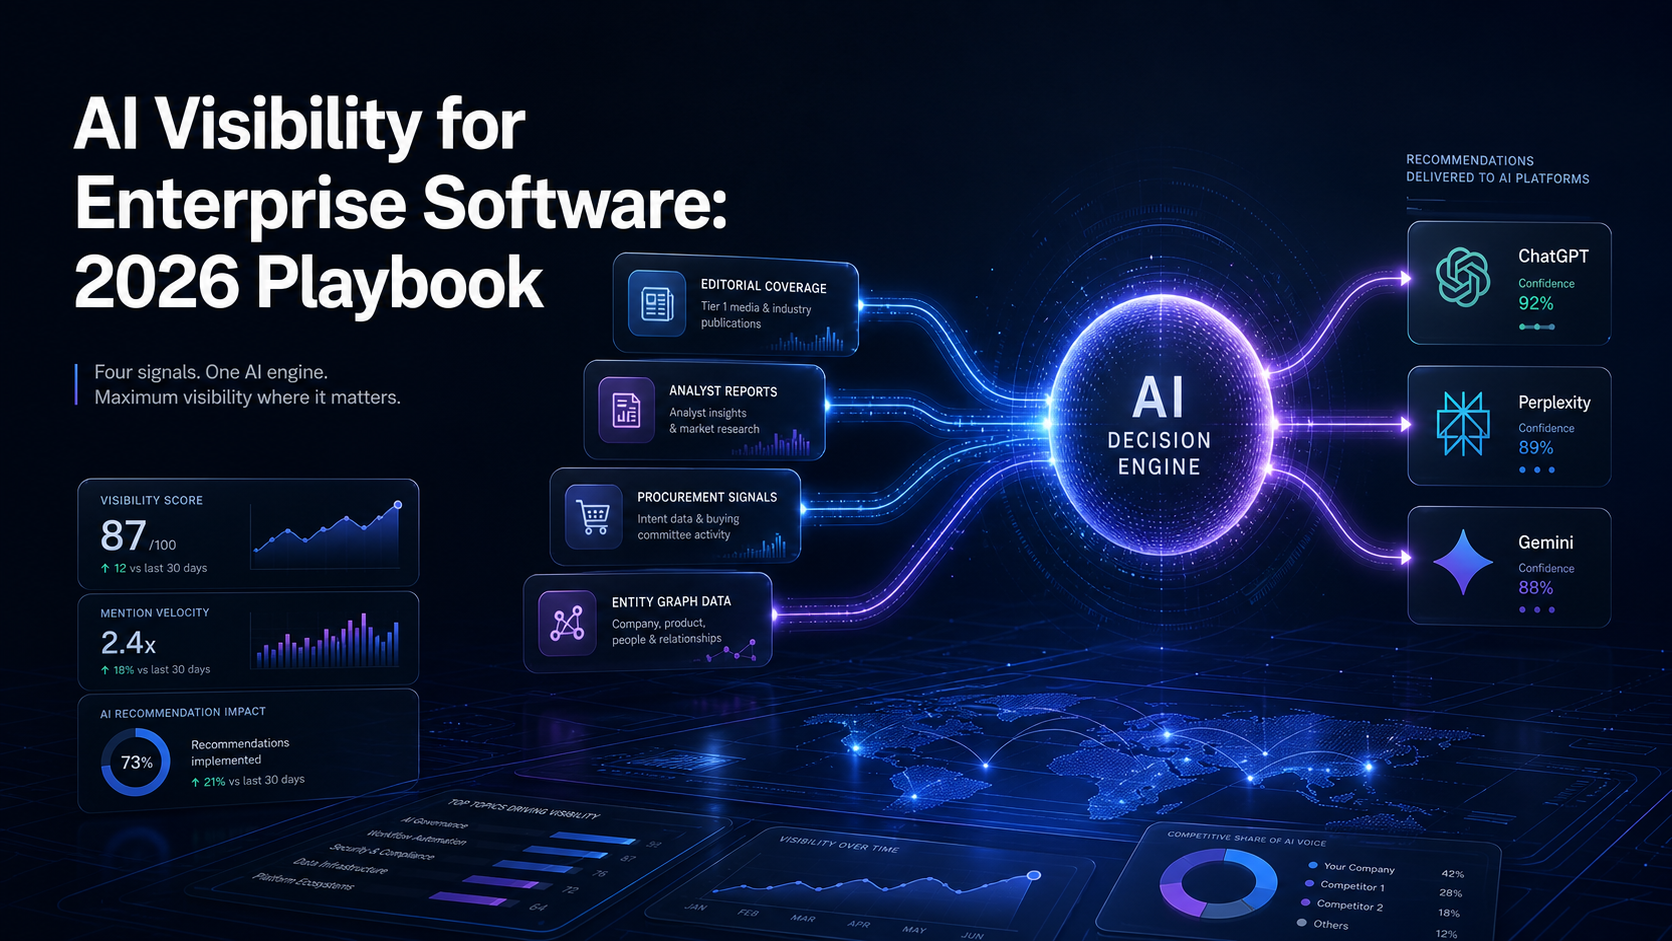
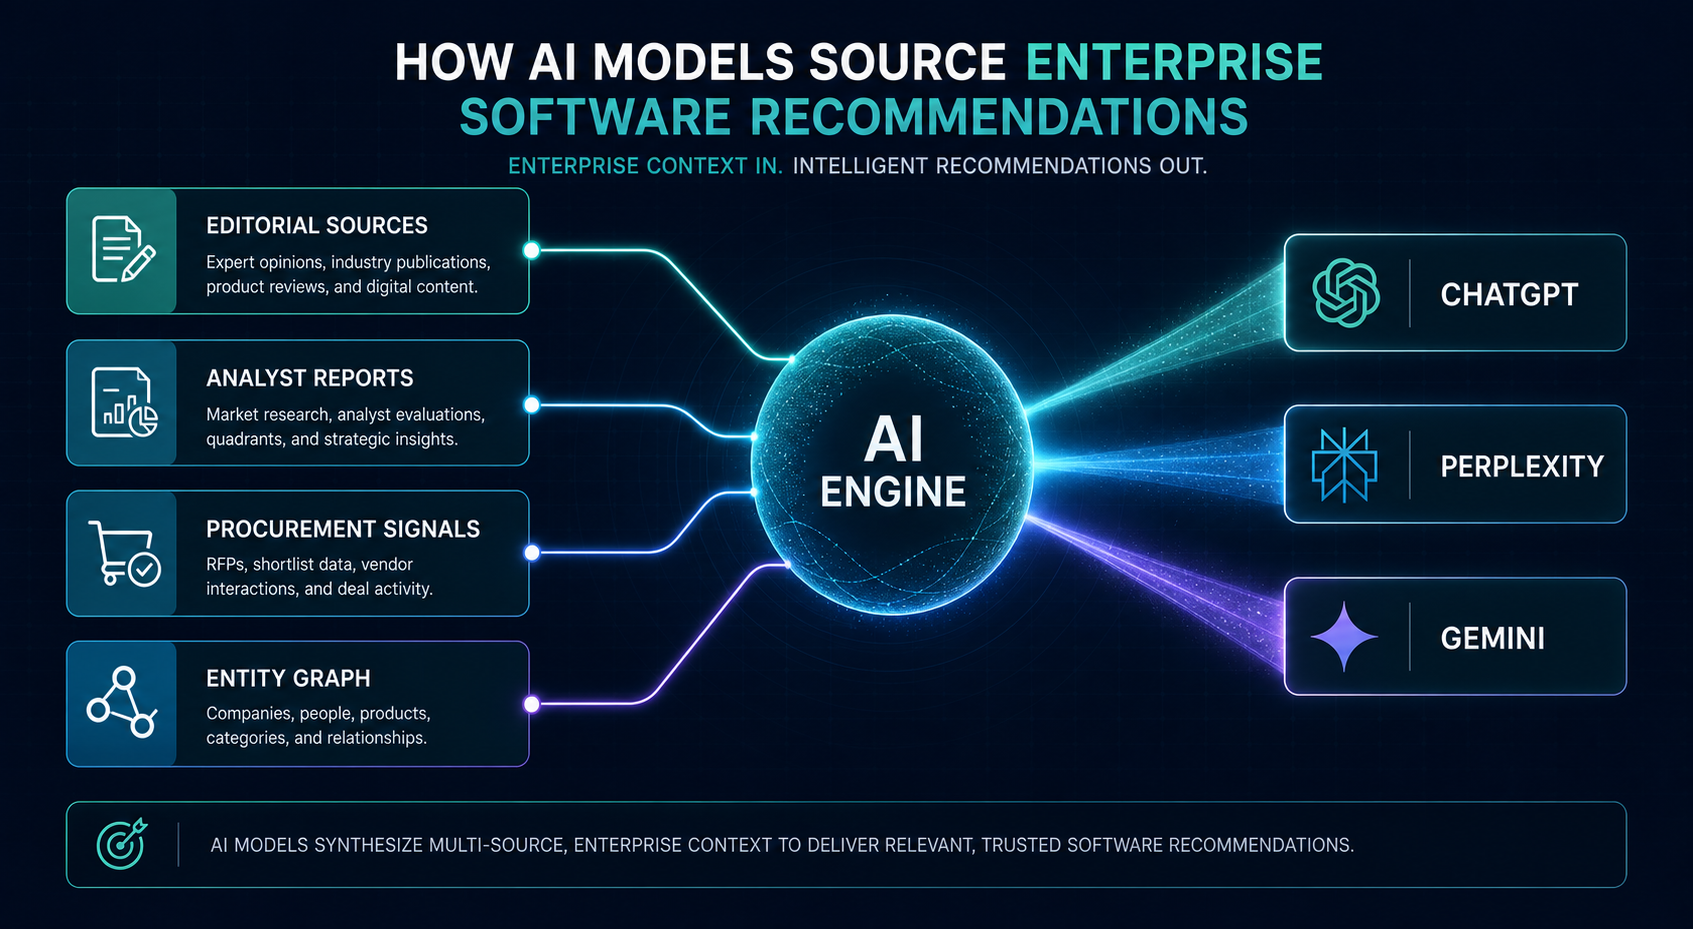
  • The four signal layers AI models use to weight enterprise vendors: editorial, analyst, procurement, and entity
  • How to audit your current AI citation rate across ChatGPT, Perplexity, Gemini, and Copilot in under 90 minutes
  • The procurement-grade content gaps that block enterprise visibility (and how to close them)
  • What to measure quarterly so your CMO and CRO see AI visibility as pipeline infrastructure, not a marketing experiment
Ai Visibility For Enterprise Software, ai-visibility-enterprise-software-signal-layers
Enterprise AI visibility runs on four signal layers, and most software vendors have built none of them.

Why Enterprise Software Has a Different AI Visibility Problem

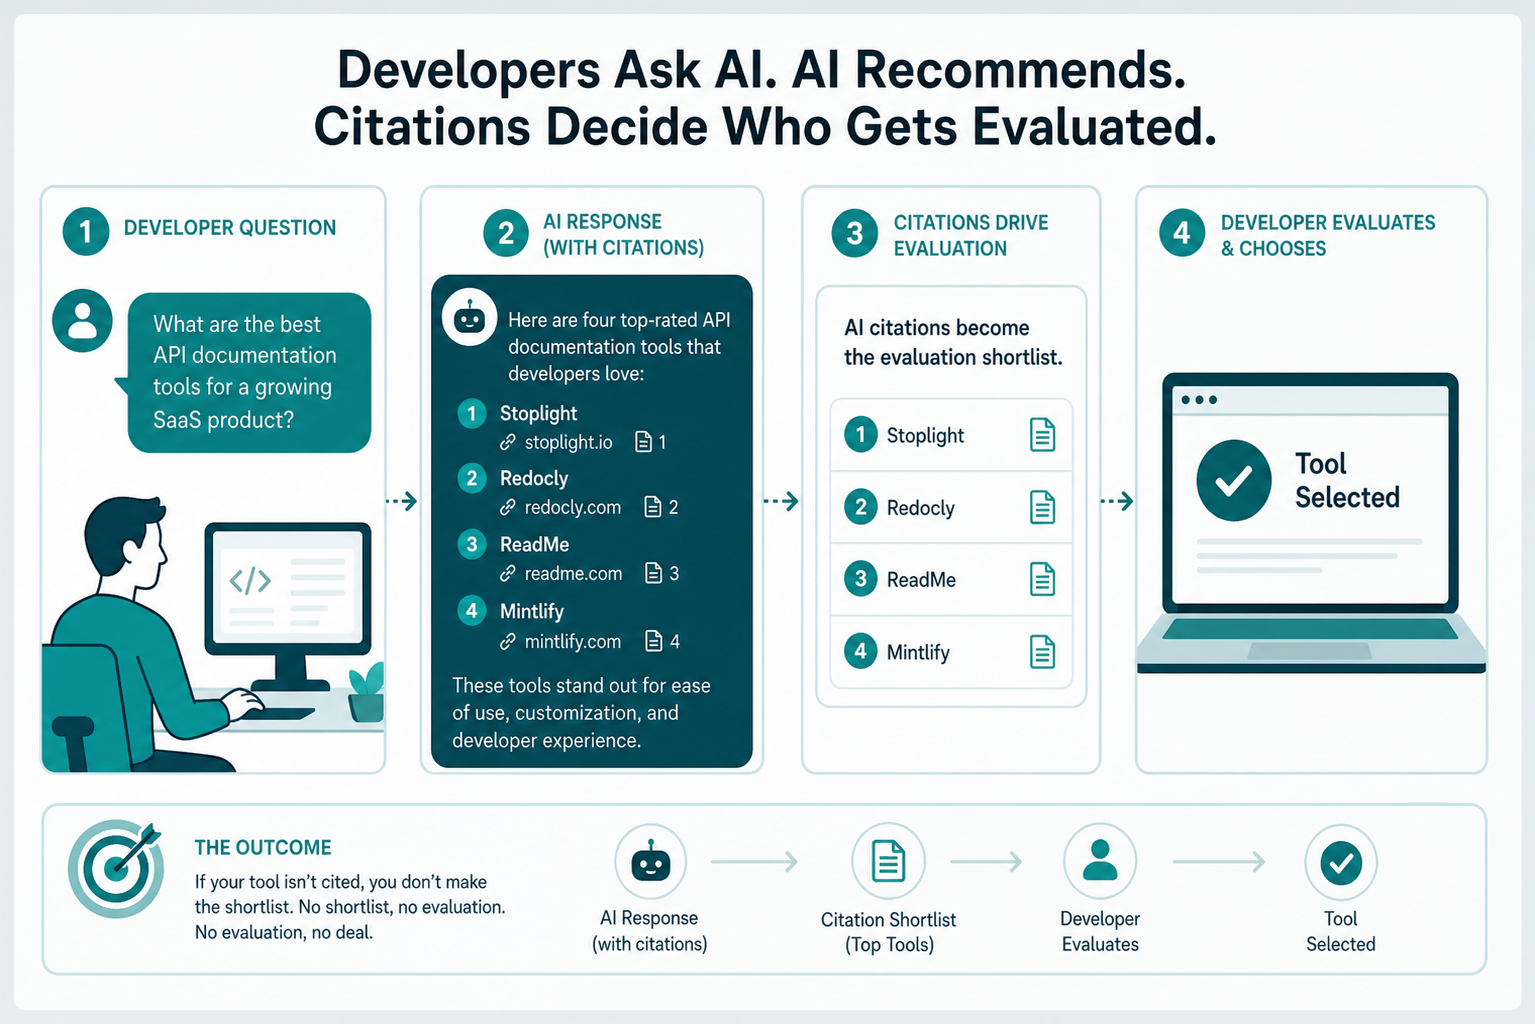
B2B SaaS visibility playbooks assume the buyer is one person making a $5K, $50K decision. Enterprise software doesn’t work that way. A $500K platform sale involves a champion, an economic buyer, a technical evaluator, a security reviewer, and a procurement lead, and each one asks AI different questions at different stages.

Signal layer What it is Buyer it answers How enterprise vendors build it
Editorial Independent coverage, reviews, and category articles that mention your product as a credible option The champion (“best alternatives to [incumbent]”) Earn mentions in third-party publications and category comparisons buyers and models already trust
Analyst Recognition in analyst evaluations and category research that models treat as authoritative The economic buyer evaluating the category Get represented in analyst reports and named in the vendor landscape for your category
Procurement Machine-readable security, compliance, and pricing facts (e.g., SOC 2, HIPAA, typical enterprise pricing) The security reviewer and procurement lead Publish procurement-grade content stating certifications, compliance scope, and pricing clearly
Entity A consistent, structured definition of your company that models can resolve and connect The technical evaluator confirming who you are Keep your company described the same way across the sources models read so they resolve you as one clear entity

The champion asks “best alternatives to Snowflake for healthcare data.” The security reviewer asks “is Databricks SOC 2 Type II compliant for HIPAA workloads.” The procurement lead asks “typical enterprise pricing for cloud data warehouses.” If your brand only surfaces for one of these queries, you’re invisible at three of the five touchpoints that actually decide the deal.

That’s the structural problem. Enterprise software needs visibility across a wider query surface, and across query types that consumer-grade content rarely satisfies. AI models won’t cite your blog post about “10 reasons to choose our platform” when a CISO asks about compliance posture. They’ll cite the Gartner Magic Quadrant, the G2 Enterprise Grid, the analyst report your competitor sponsored last quarter, and the practitioner thread on Stack Overflow where your product never appeared.

This is the gap. And it’s why enterprise software vendors with strong G2 reviews and decent SEO still get zero AI citations for high-intent enterprise queries. The inputs AI models trust for enterprise decisions are different from the inputs they trust for SMB decisions. Most marketing teams haven’t adjusted.

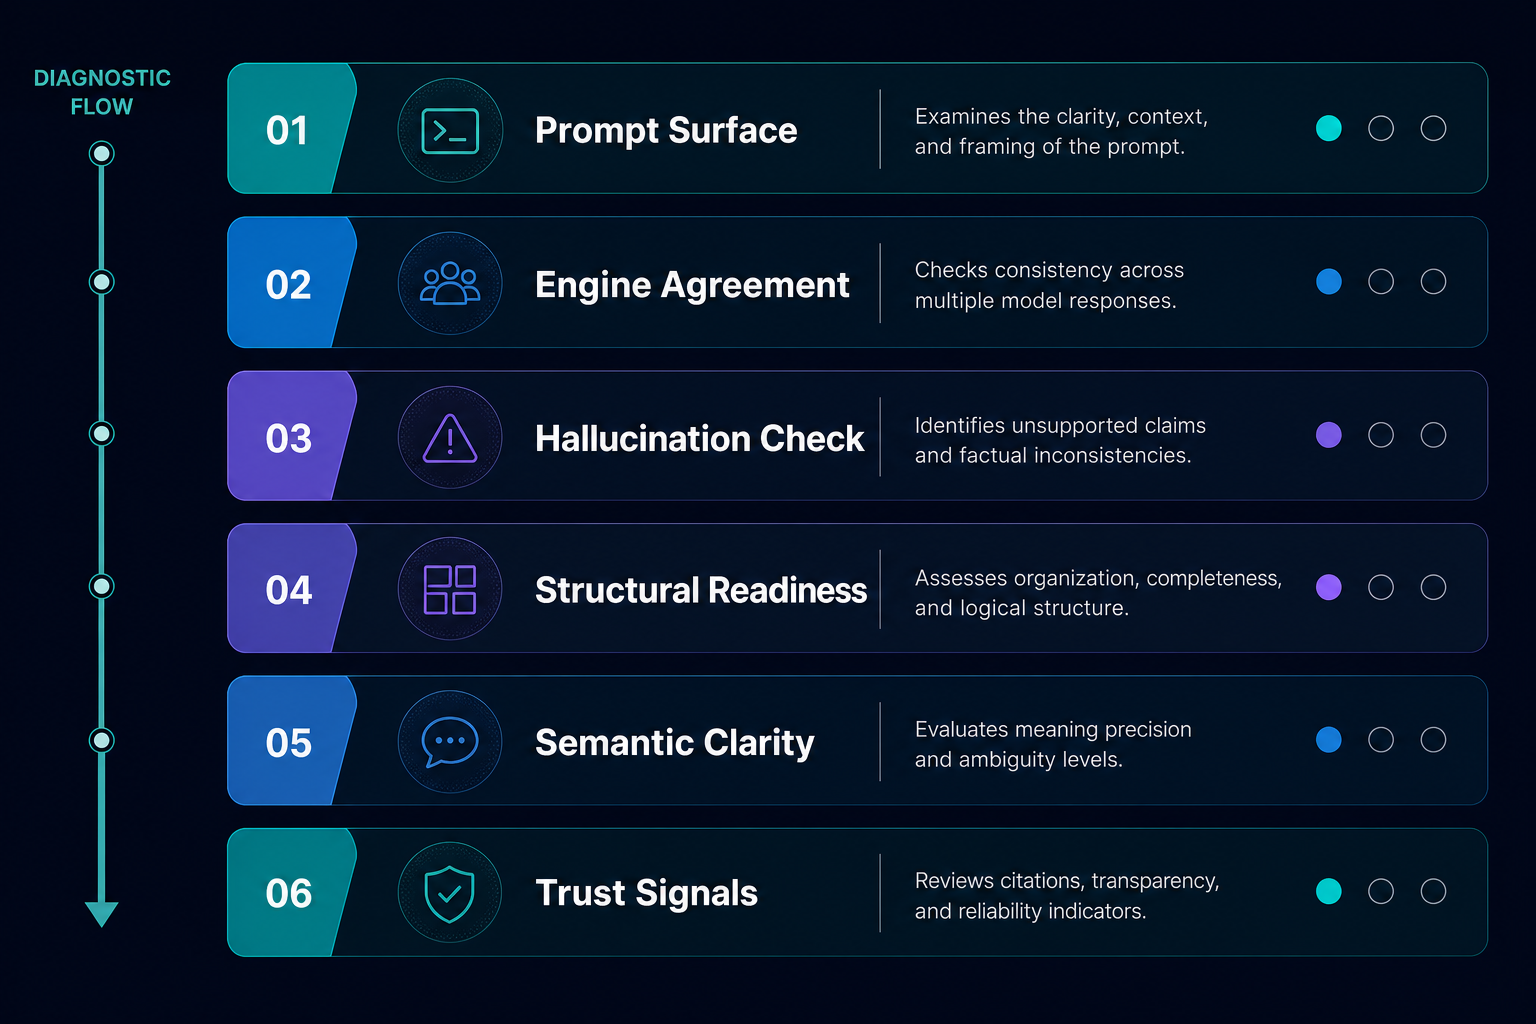
The Four Signal Layers AI Models Weight for Enterprise Vendors

After running visibility audits across hundreds of B2B software brands, four signal categories consistently determine whether an enterprise vendor gets cited:

enterprise-software-ai-visibility-signal-investment-gap
Most enterprise software teams over-invest in editorial and ignore the procurement and entity layers AI models weight most heavily for high-stakes decisions.
  1. Editorial signals, coverage in tier-1 trade publications (TechCrunch, The Information, Protocol, sector-specific outlets), executive bylines on industry sites, and original research that other publications cite back.
  2. Analyst signals, placement in Gartner, Forrester, IDC, and G2 Enterprise Grid reports. AI models index analyst content heavily because it’s structured, dated, and treated as third-party validation.
  3. Procurement signals, public pricing tiers, SOC 2/ISO 27001/HIPAA documentation, transparent SLAs, and case studies with named Fortune 1000 customers. These signal “enterprise-ready” to models trained on procurement workflows.
  4. Entity signals. Wikipedia presence, Crunchbase entity data, LinkedIn company size and growth signals, and consistent NAP across knowledge graph sources. Without entity confirmation, AI models hedge or omit your brand entirely.

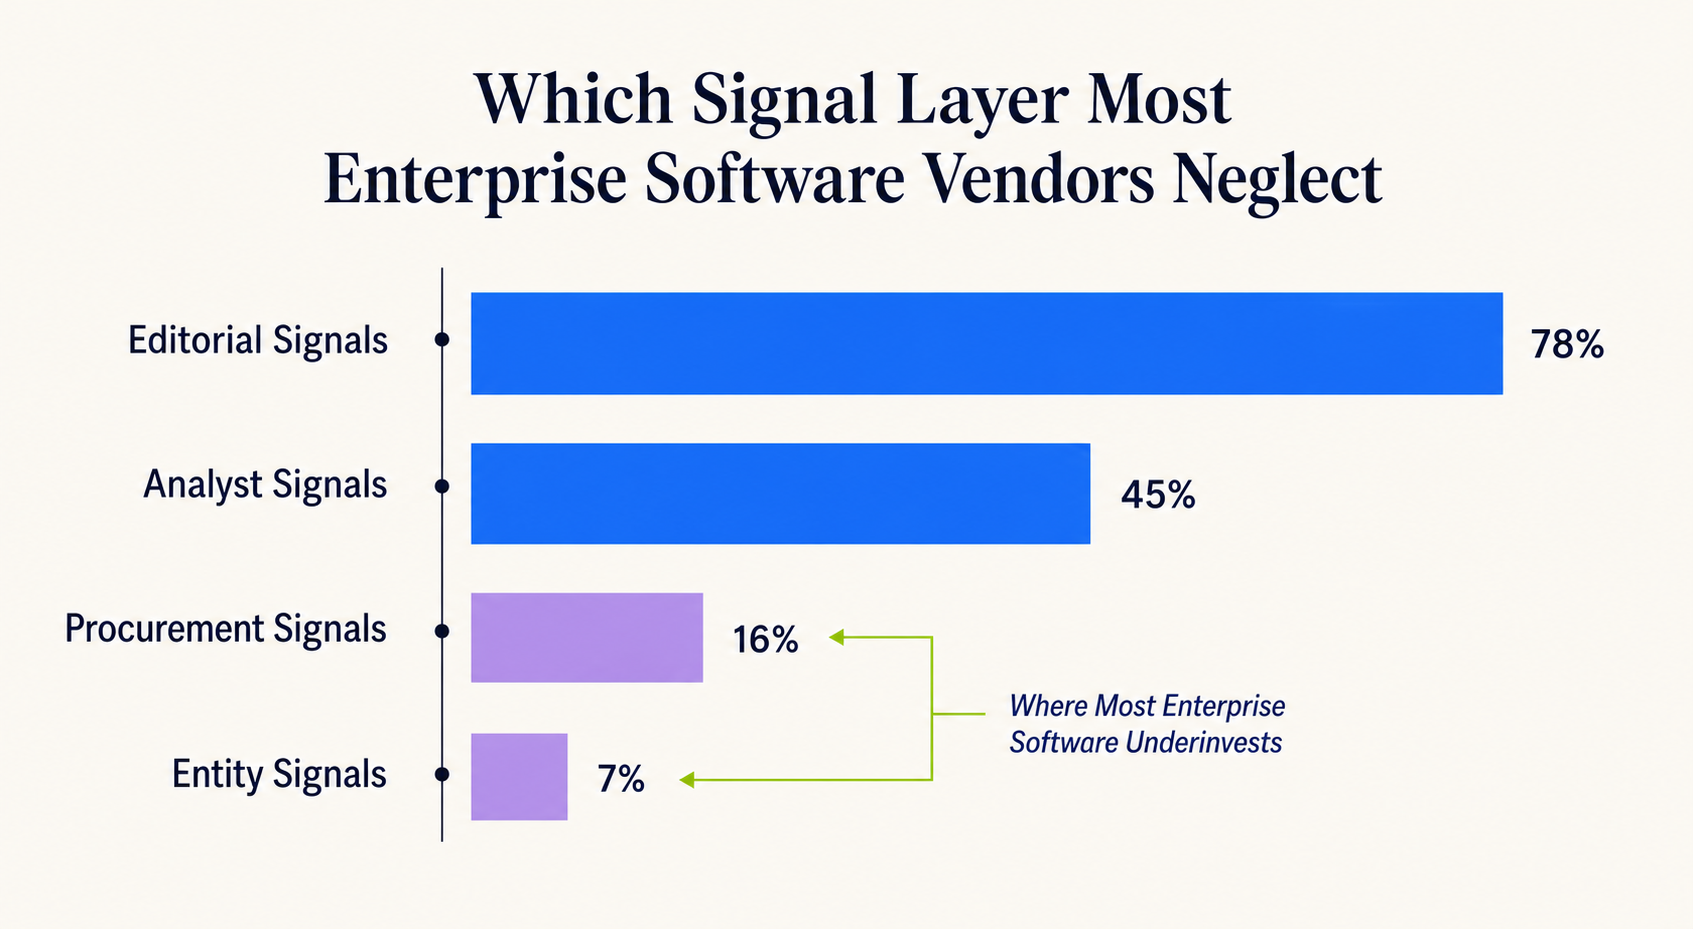
A vendor strong in two of these layers gets cited occasionally. Strong in three gets cited consistently. Strong in all four gets recommended by default, which is the only position that matters when a $1M deal starts with an AI query.

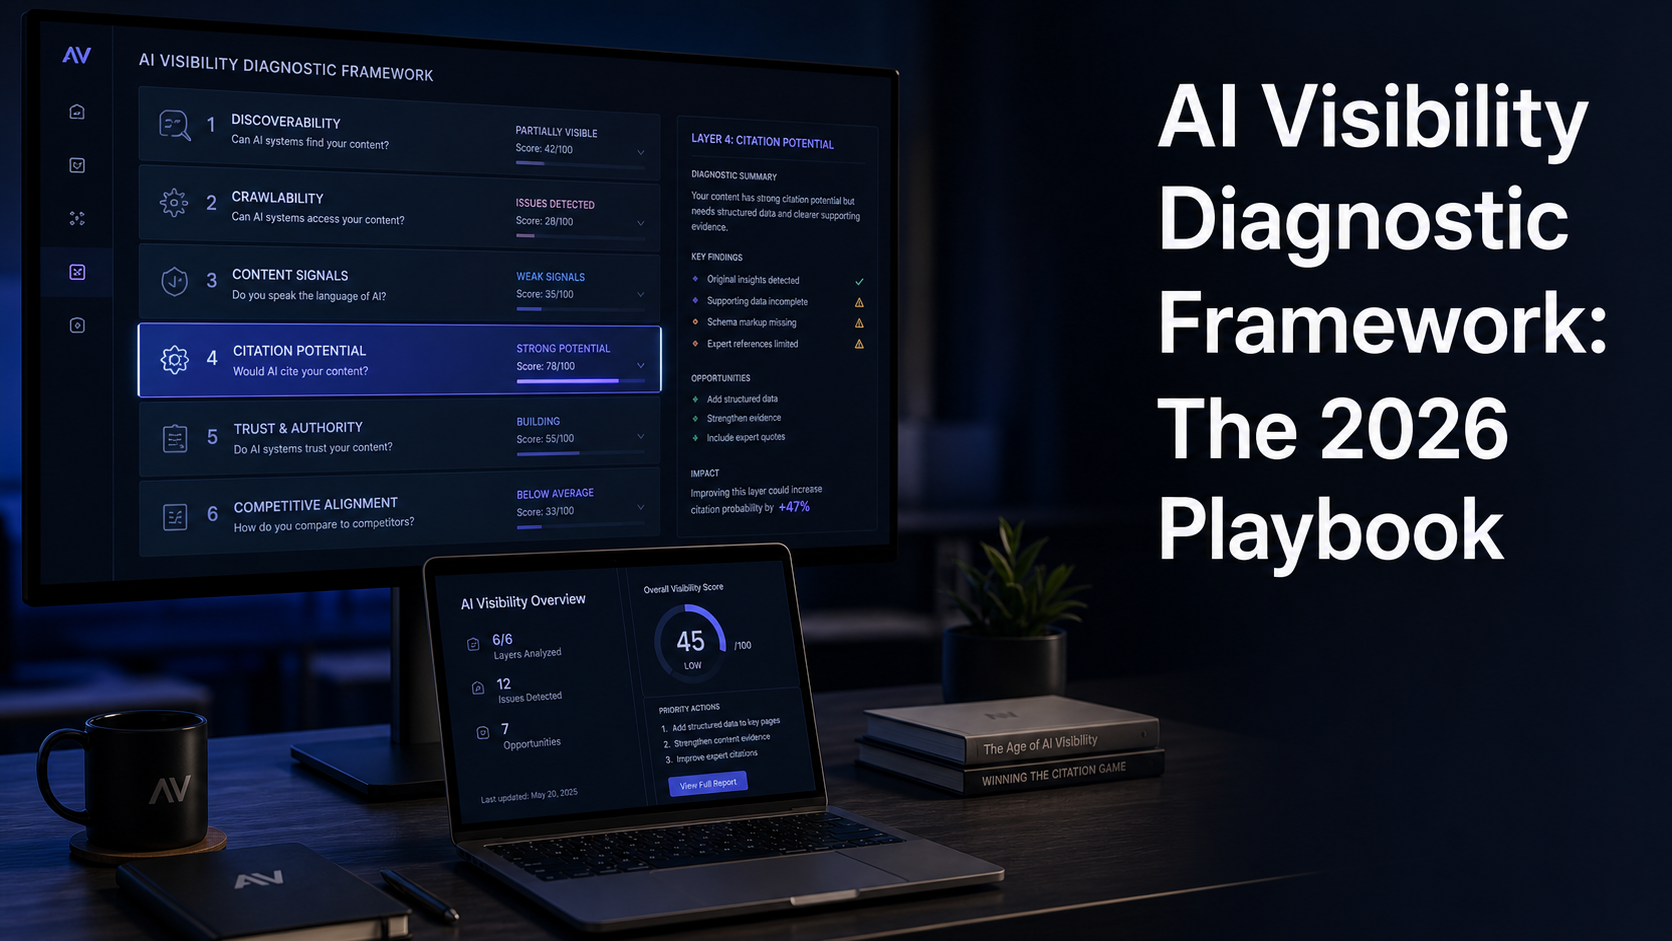
How to Audit Your Current AI Visibility in Under 90 Minutes

Before fixing anything, you need a baseline. Here’s the audit we run before any enterprise engagement. It takes about 90 minutes and requires no tooling beyond a free account on each AI platform.

Step 1: Build Your Query Matrix (20 minutes)

List 15 queries across five buyer roles. For each role, write three queries, one early-stage (“what is data observability”), one comparative (“Datadog vs Splunk for enterprise logs”), and one high-intent (“best enterprise APM platform with HIPAA compliance”). The mix matters. Visibility on early-stage queries means nothing if you’re invisible when buyers are ready to act.

Step 2: Test Across Four Engines (40 minutes)

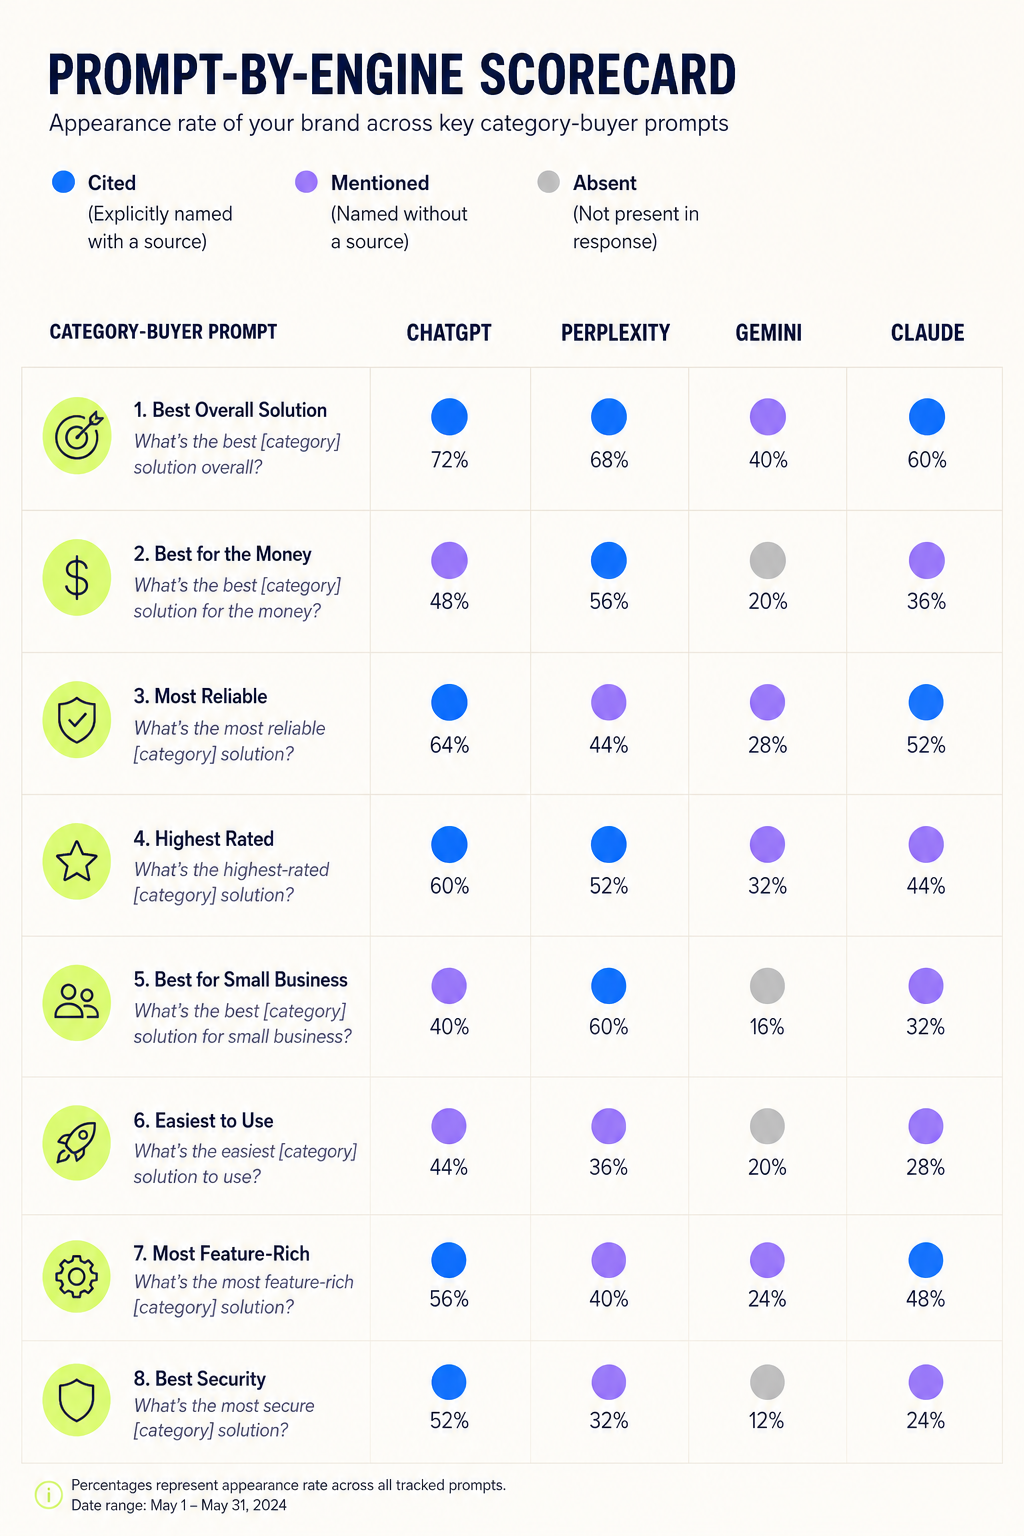
Run every query in ChatGPT (with browsing on), Perplexity, Gemini, and Microsoft Copilot. Record three data points per query: (1) does your brand appear, (2) what position in the response, (3) which sources the AI cited to justify the recommendation.

That third data point is the one most teams skip. It’s also the most valuable. If Perplexity cited G2, a Forrester Wave, and a TechCrunch piece, none of which mention your product, you now know exactly which sources to target.

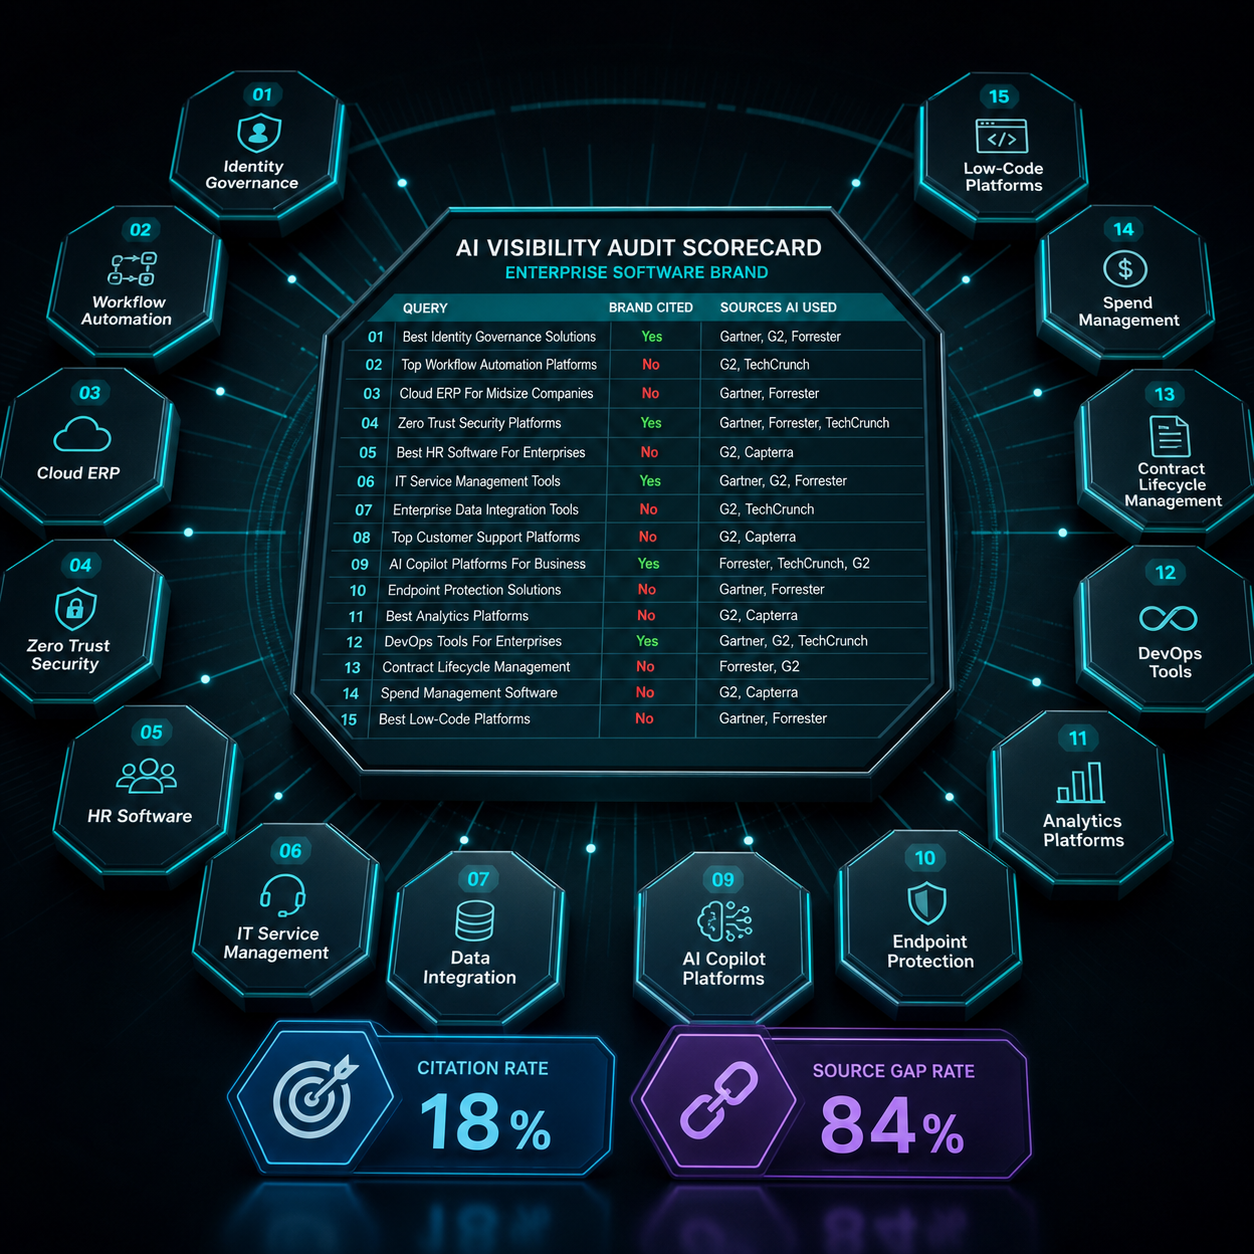
Step 3: Score Citation Rate and Source Gaps (20 minutes)

Calculate two numbers. Citation rate = queries where your brand appeared รท total queries. Source gap rate = cited sources where you’re absent รท total cited sources. Most enterprise software vendors we audit score under 20% on citation rate and over 80% on source gap rate. Those numbers are your starting line.

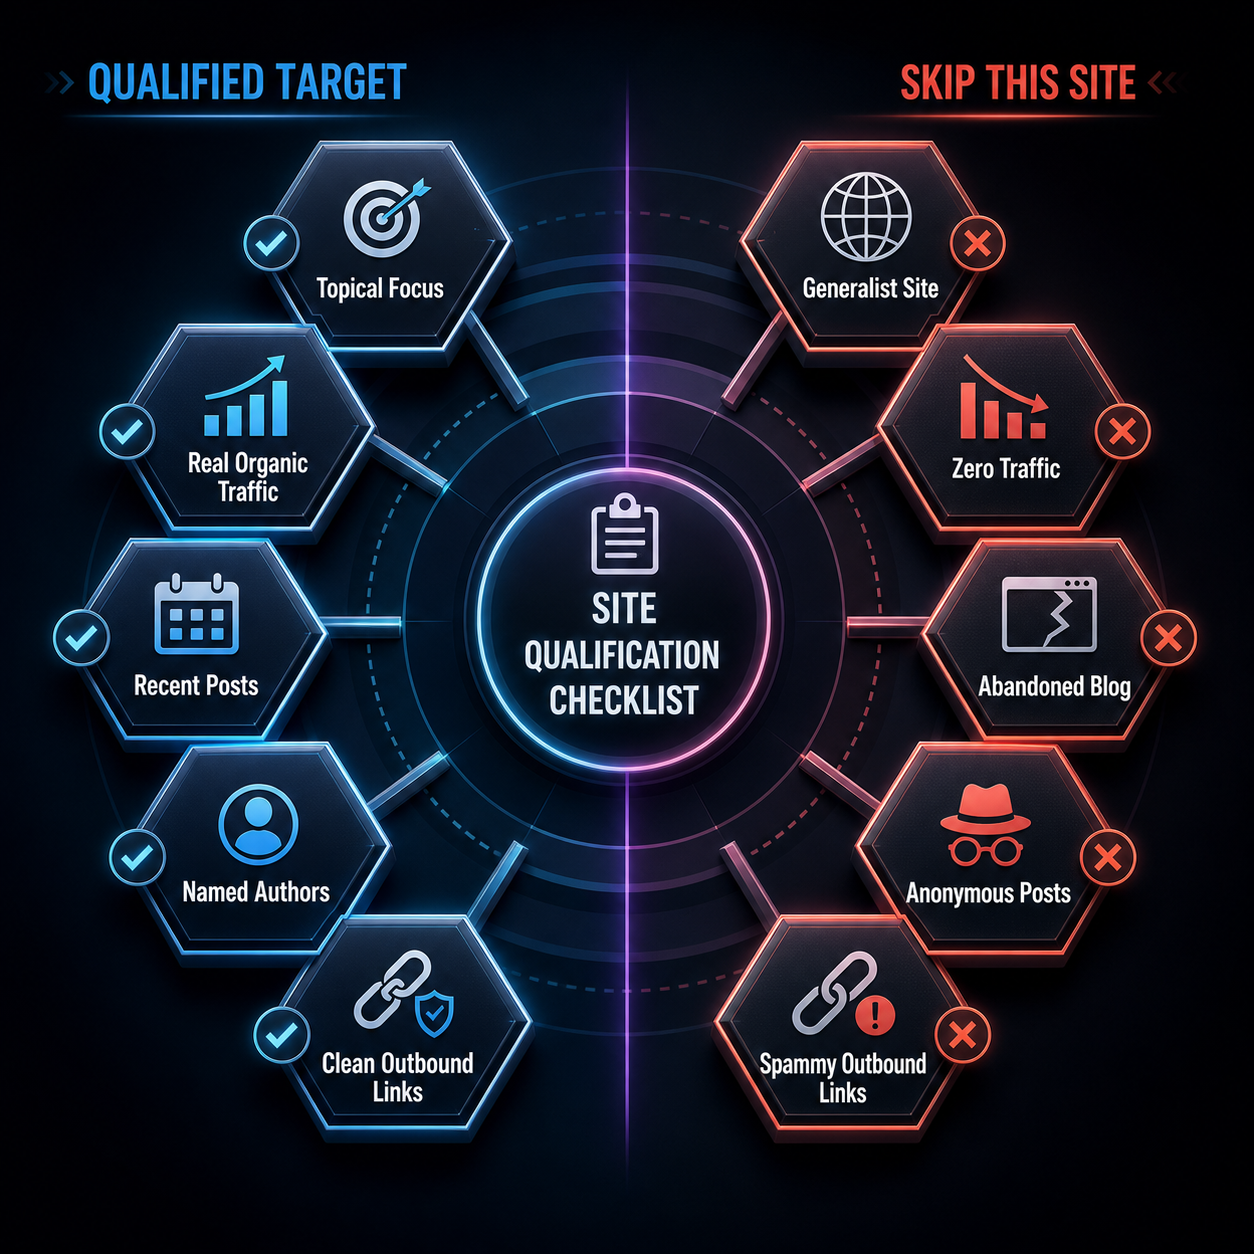
Step 4: Identify the Highest-use Sources (10 minutes)

Sort the cited sources by frequency across your 15 queries. The sources cited most often are your highest-use targets. If G2 is cited in 11 of 15 queries and you have 12 reviews while your competitor has 340, that’s not an AI visibility problem you’ll solve with blog content. That’s a review acquisition problem masquerading as one.

enterprise-software-ai-visibility-audit-scorecard
A 90-minute audit produces a ranked fix list, citation rate becomes a number your CMO can track quarterly.

The audit output is a ranked list of fixable gaps. You can run it again every quarter and watch the citation rate climb as you close them.

Closing the Procurement-Grade Content Gaps

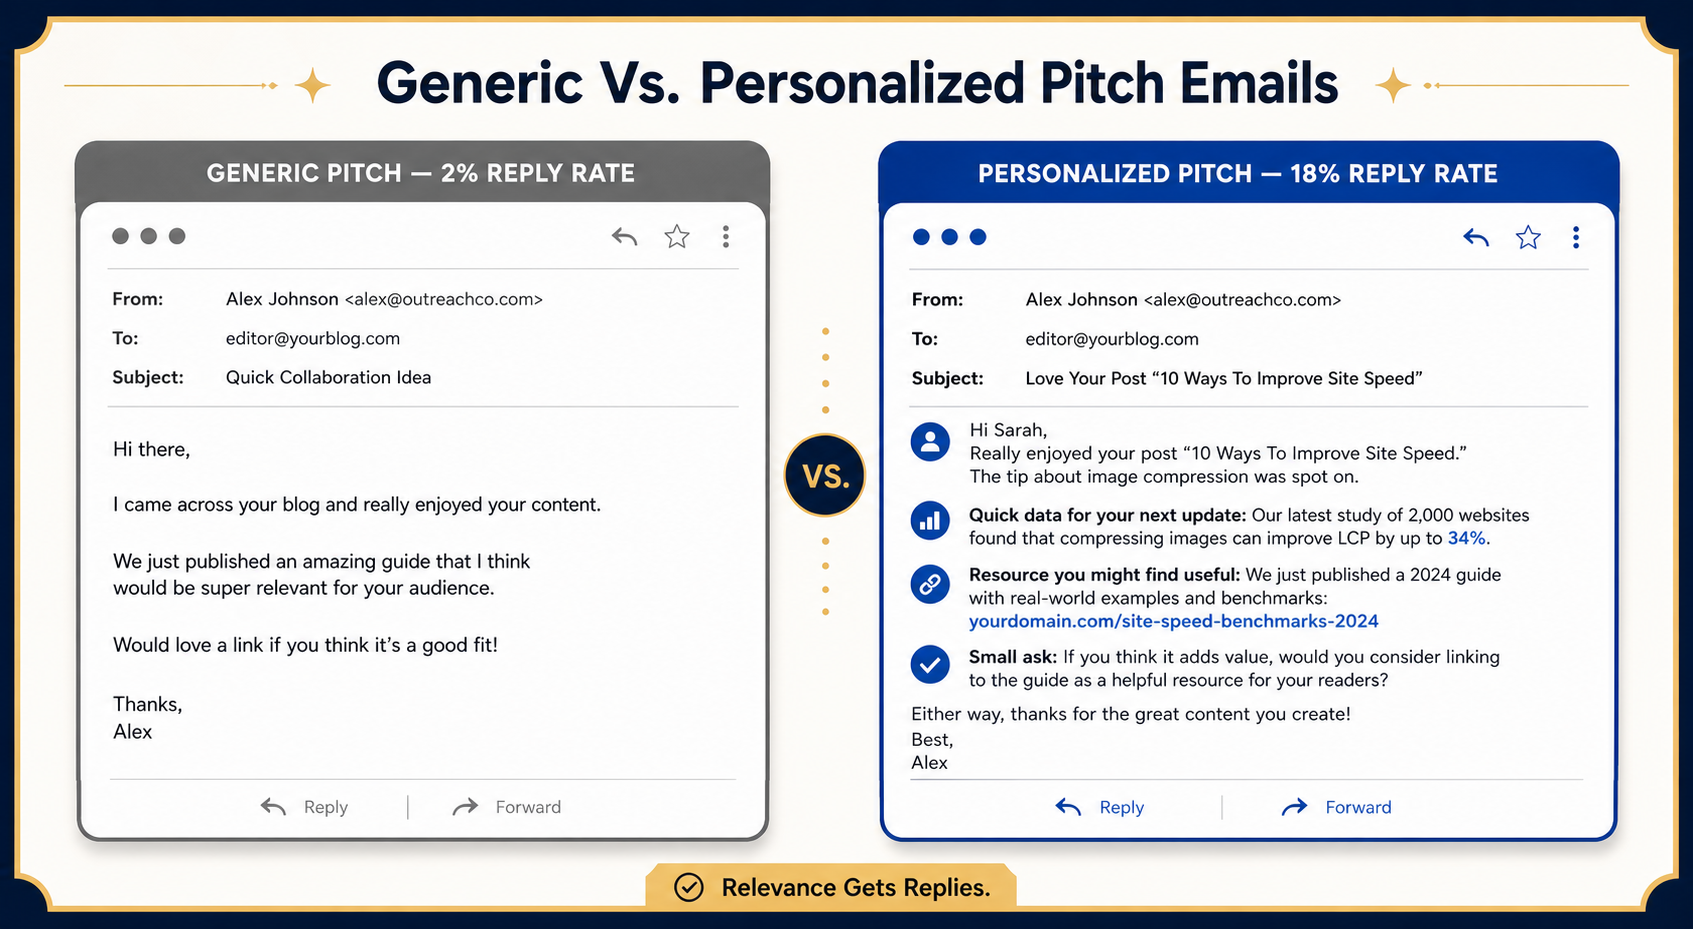
Once you’ve audited, the work splits into two streams: content you control and signals you earn. Most enterprise software teams over-invest in the first and ignore the second. That’s backwards. AI models weight earned third-party signals more heavily than owned content for enterprise queries, because procurement decisions are too high-stakes for models to recommend based on self-published claims.

But owned content still matters in one specific way: it needs to be machine-readable enough for AI to extract procurement-grade facts. That means structured, dated, and specific.

What Procurement-Grade Content Looks Like

Take a security page. Most enterprise software vendors have a page that says “We take security seriously. We’re SOC 2 compliant and follow industry best practices.” That sentence tells an AI model nothing it can cite back.

A procurement-grade version reads: “Acme is SOC 2 Type II audited annually by Schellman, with our most recent report covering January 2026 through December 2026. We maintain ISO 27001:2022 certification (certificate number XXXXX, valid through March 2027) and offer HIPAA Business Associate Agreements for healthcare customers on Enterprise plans.”

The second version is extractable. An AI model asked “is Acme SOC 2 compliant” can cite the specific report period. Asked about HIPAA, it can confirm the BAA availability and the plan tier. This is what “answerable content” means at the enterprise tier, and it’s the foundation of scalable AI visibility for B2B software.

The Five Pages Every Enterprise Software Site Needs

  1. Security & compliance page with specific certifications, dates, audit firms, and customer-grade documentation
  2. Pricing tier page with enough specificity that AI can answer “what does enterprise tier include”, even if exact prices are gated
  3. Integration directory listing every supported system with version compatibility and authentication method
  4. Customer page with named enterprise logos, industry verticals served, and case studies tied to measurable outcomes
  5. Comparison pages for your top 5 named competitors, written with intellectual honesty, not feature-bait

Each of these pages exists to give AI models extractable facts when buyers ask procurement-level questions. The absence of any one of them is a citation gap your competitors will fill.

Earning the Signals You Don’t Control

The harder work is on the earned side. AI models cite Gartner, Forrester, G2, TechCrunch, and tier-1 trade press because those sources have editorial standards and were indexed during training in ways that mark them as authoritative. Your blog post, no matter how good, won’t substitute.

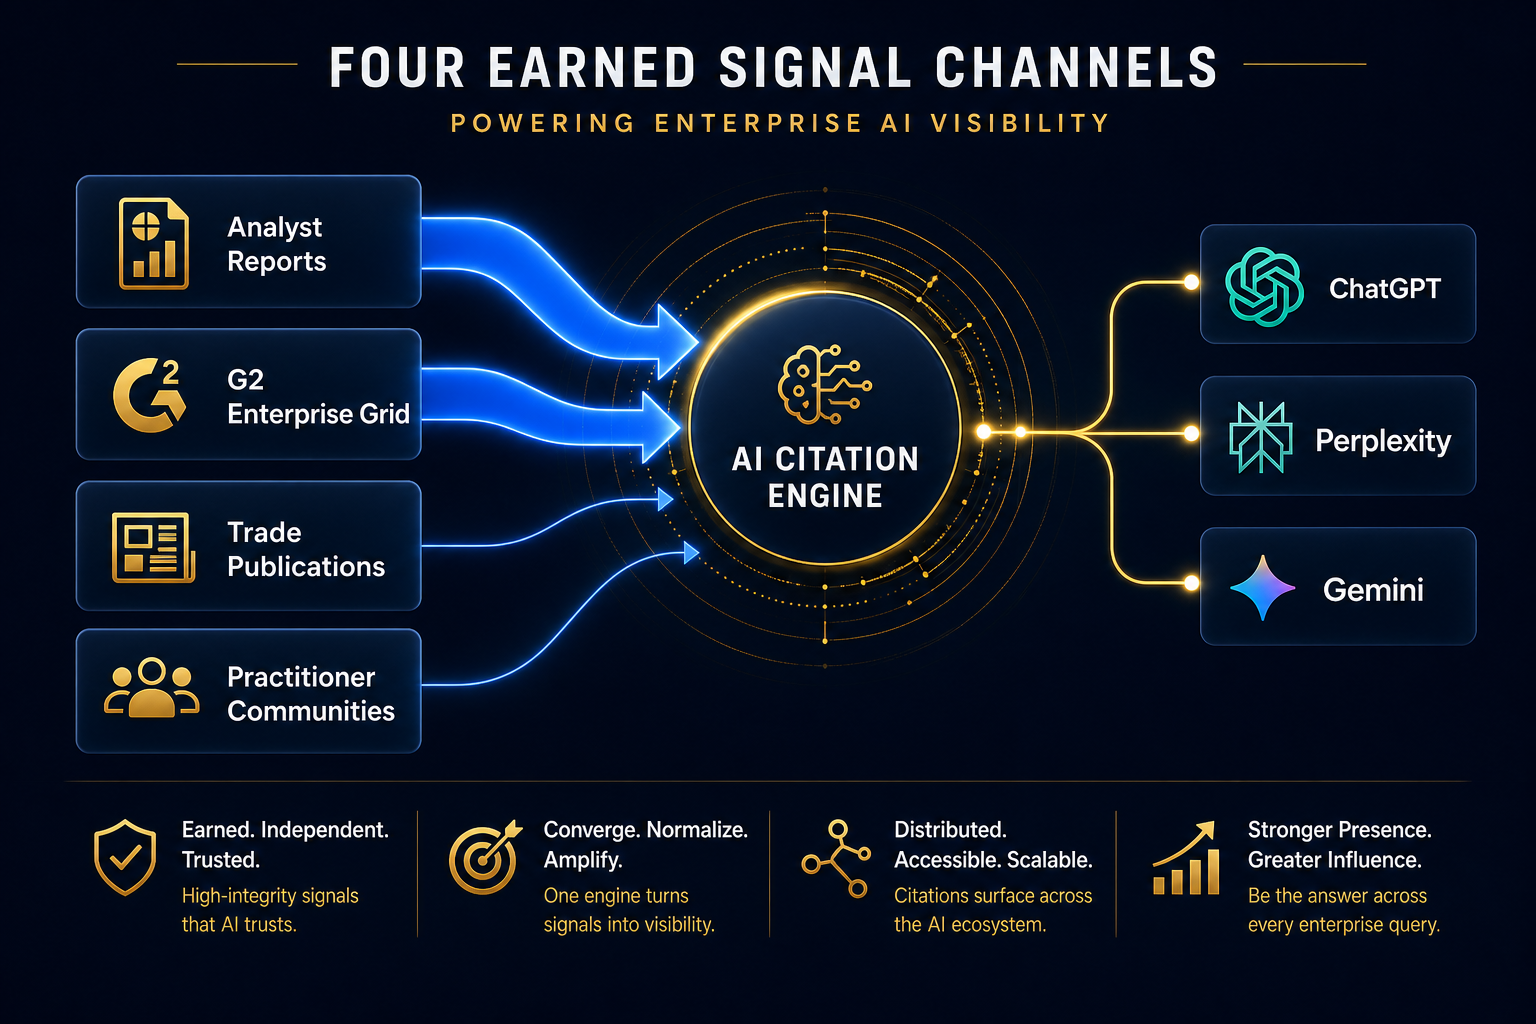
For enterprise software, four earned channels move the needle:

Analyst Briefings That Translate to Reports

Gartner, Forrester, and IDC analysts publish reports AI models heavily index. If you’re not in the Magic Quadrant, the Wave, or the MarketScape for your category, you’re invisible to AI in any query where analyst context drives the answer. Budget for analyst relations the same way you budget for paid media. The reports compound for years.

G2 Enterprise Grid Placement

G2 is cited in roughly 70% of B2B software AI responses we’ve measured. The Enterprise Grid (filtered to companies over $1B revenue) is what matters for enterprise queries. That requires reviews from actual enterprise users, not SMB customers padding your overall rating.

Tier-1 Trade Publication Coverage

Earned coverage in publications AI models trust, not press release distribution. The Information, Protocol, TechCrunch’s enterprise vertical, sector-specific trades like Healthcare IT News or FinTech Futures. One substantive feature outperforms 50 syndicated press releases. This is the kind of editorial coverage that compounds over time.

Practitioner Communities Where Buyers Verify

Reddit’s r/sys****SECRET_REDACTED****, r/devops, r/cybersecurity, and Stack Overflow tags for your category. Enterprise buyers cross-check AI recommendations against practitioner discussions. If those threads don’t mention your product, or worse, mention it negatively. AI models notice. The Reddit authority playbook matters more for enterprise software than most teams realize, because technical buyers verify there first.

earned-ai-visibility-signal-channels-enterprise-software
Earned signals carry more weight than owned content for enterprise queries, and analyst plus G2 carry the most.

The Entity Layer Most Enterprise Teams Forget

The fourth signal layer, entity confirmation, is where I see the most preventable losses. AI models need to confirm your company exists, what category it operates in, who founded it, and roughly how large it is. If they can’t confirm these basics from authoritative entity sources, they hedge or omit you from recommendations entirely.

The entity sources that matter for enterprise software:

  • Wikipedia, even a stub page dramatically increases citation confidence
  • Crunchbase, funding, headcount, leadership data structured for machine consumption
  • LinkedIn, company size, growth trajectory, employee technical skills
  • Google Knowledge Panel, the public-facing entity confirmation
  • Wikidata, the underlying structured data that powers knowledge graphs

Most enterprise software companies have inconsistencies across these sources, different founding dates, different headcount ranges, different category descriptions. Each inconsistency is friction. Cleaning up entity data is the lowest-cost, highest-use AI visibility work most teams haven’t done. This is foundational entity SEO work that compounds across every AI surface.

Measuring What Matters Quarterly

Enterprise CMOs don’t want another vanity metric. The measurement frame that survives executive scrutiny tracks three numbers:

  1. Citation rate, percentage of your tracked query matrix where your brand appears. Track per engine. Target 60%+ on high-intent queries within 12 months.
  2. Share of recommendation, when AI lists multiple options, where do you rank? Position 1, 3 is the only one that matters; positions 4+ rarely convert to consideration.
  3. Source coverage, percentage of AI-cited sources where your brand has presence. This is the leading indicator. Citation rate follows source coverage with a lag of 60, 120 days.

Report these quarterly to the CRO. Tie them to pipeline influence by tracking AI-referred traffic through GA4 and pipeline conversion rates on AI-sourced leads. The pattern we see: AI-referred leads close at 2, 3x the rate of paid search leads because the AI did the qualification work upfront.

A Realistic Timeline for Enterprise Visibility

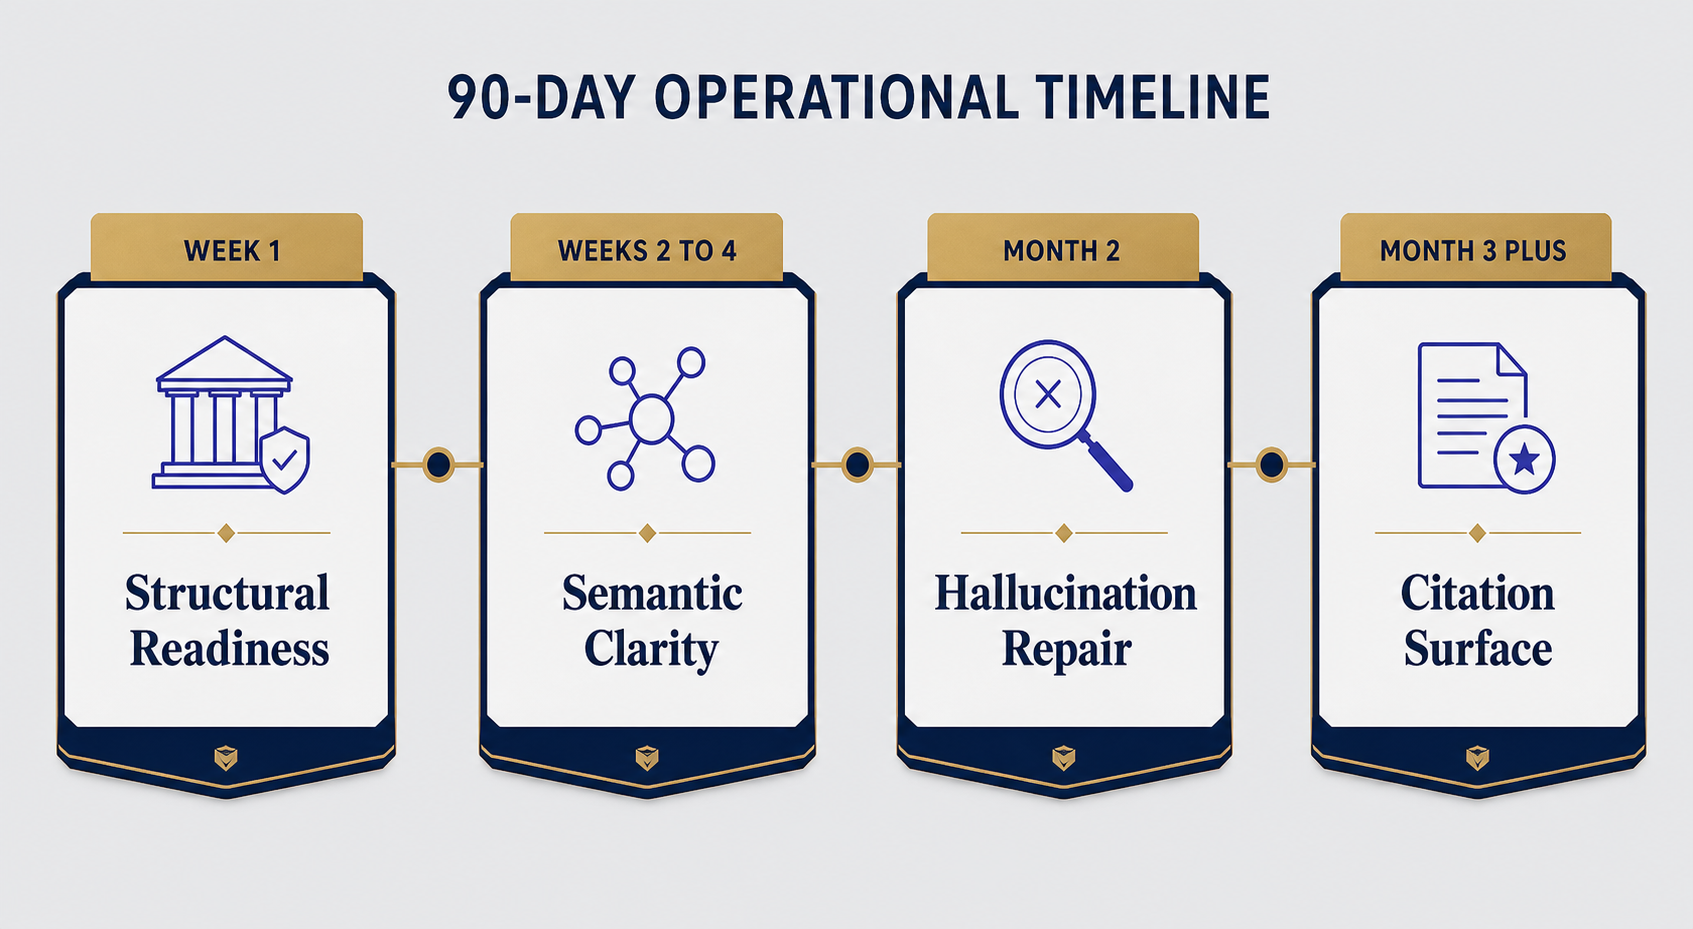
Entity cleanup shows results within 30 days. Owned content updates move citation rates in 60, 90 days. Earned signals, analyst reports, G2 enterprise reviews, trade press, compound on a 6, 12 month curve. Anyone selling you 30-day enterprise AI visibility results is selling you something else.

The brands winning enterprise software AI visibility in 2026 started this work in late 2024 and early 2025. The brands starting now are competing for 2027 positioning. That’s the actual timeline.

Enterprise software brands need analytics that scale across product lines. The platform comparison for AI visibility analytics covers which tools handle multi-product portfolios without dashboard sprawl.

Frequently Asked Questions

How is AI visibility for enterprise software different from B2B SaaS?

Enterprise software requires visibility across more buyer roles and more query types, particularly procurement, security, and compliance queries that B2B SaaS rarely faces. AI models weight analyst reports, named enterprise customer references, and structured compliance documentation more heavily for enterprise vendors than for SMB-focused software. The signal mix shifts from “G2 reviews and content marketing” to “Gartner placement, enterprise case studies, and procurement-grade documentation.”

Which AI engines should enterprise software brands prioritize?

ChatGPT and Perplexity drive the most buyer research traffic, with Microsoft Copilot growing fast inside enterprise environments where it’s the default assistant. Gemini matters because of Google Workspace penetration. Prioritize by where your specific buyers actually work, if you sell to financial services, Copilot inside Microsoft 365 matters more than consumer ChatGPT.

Do we still need traditional SEO if we focus on AI visibility?

Yes. AI models heavily cite content that ranks well in traditional search, especially for technical queries. Strong SEO is now a precondition for AI visibility, not a replacement for it. The strategy is integrated, content built for citation extraction also tends to rank, and content that ranks gets cited more often.

How long before we see results from an enterprise AI visibility program?

Entity cleanup and structured content updates show movement in 30, 90 days. Earned signals, analyst reports, tier-1 press, enterprise reviews, show up in citation rates over 6, 12 months. Most enterprise software brands see citation rates double in 6 months and quadruple in 12 if they execute across all four signal layers.

What’s the single biggest mistake enterprise software teams make with AI visibility?

Treating it as a content marketing problem. AI visibility for enterprise software is 30% content, 70% earned signals and entity infrastructure. Teams that pour budget into blog content and ignore analyst relations, G2 enterprise reviews, and entity cleanup get marginal returns. The teams that win invert that ratio.

How do we measure ROI on AI visibility for enterprise deals?

Track AI-referred traffic in GA4, tag those visitors as a discrete lead source, and measure pipeline conversion and close rates against other channels. Most enterprise software teams find AI-referred leads convert at 2, 3x the rate of paid search because buyers arrive already qualified. The reporting frame that lands with CFOs: pipeline influenced divided by program cost, tracked over rolling 12-month windows.

Should we build this in-house or work with a specialized agency?

The entity cleanup and content restructuring can be in-house if you have a technical SEO lead who understands schema, knowledge graphs, and citation mechanics. The earned signal work, analyst relations, G2 enterprise programs, tier-1 press, typically requires either dedicated specialists or a partner with established relationships. The most expensive mistake is having a content team try to manage analyst relations on the side.

The Window Is Closing Faster Than You Think

Enterprise buyers consulted AI for a quarter of their software research in early 2025. By late 2026, the number is closer to two-thirds and climbing. The brands that built citation infrastructure in 2026, 2025 are now the default recommendations for their categories, and displacing a default takes years of investment, not months. If your enterprise software brand isn’t yet showing up when buyers ask AI for recommendations, the right move isn’t to panic. It’s to run the audit this week, identify the three highest-use gaps, and start closing them quarter by quarter. The compounding starts the day you begin. Want help mapping your current AI visibility against your top three competitors? Request an AI visibility audit and we’ll send back a ranked fix list within 10 business days.

Link Building Consultant: How to Hire One That Delivers

link-building-consultant-vs-agency-vs-in-house-comparison

Hiring a link building consultant sounds simple until you start interviewing them. Half quote $5,000 a month for “white-hat outreach.” The other half quote $500 and promise the same thing. Both can’t be right, and usually neither is. The gap between a consultant who moves your rankings and one who burns six months of budget comes down to three things: how they qualify prospects, how they handle anchor text, and whether they show you the actual placements before they happen.

A link building consultant is an independent specialist who plans, executes, and reports on backlink acquisition for a single client or a small portfolio, typically working solo or with a tight contractor team rather than as part of a large agency. The good ones earn their fee by saving you from the 80% of link tactics that don’t work anymore. The bad ones resell the same Fiverr placements you could buy yourself for a tenth of the price.

This guide covers what consultants actually do day-to-day, how to vet them before you sign, realistic 2026 pricing, the questions that separate operators from resellers, and when an in-house hire or agency makes more sense.

What You’ll Learn

  • The exact deliverables a competent link building consultant owns (and the ones they shouldn’t)
  • How consultant pricing breaks down in 2026, retainer, per-link, project, and hybrid models
  • 14 vetting questions that expose resellers in under 30 minutes
  • When to hire a consultant vs. an agency vs. building in-house
  • The four red flags that mean walk away, even if the price looks good
Link Building Consultant, link-building-consultant-vs-agency-vs-in-house-comparison
A consultant sits between solo freelancer and full agency, closer to your team than either, with the strategy ownership of neither.

Most job titles in SEO are vague. This one shouldn’t be. A consultant owns the strategy, the prospect list, the outreach quality, and the reporting. They don’t own content production at scale (that’s an agency model) and they don’t own technical SEO fixes (that’s your developer or in-house SEO).

The day-to-day work splits into five things:

Before they pitch anything, a competent consultant pulls your existing link profile through Ahrefs, Semrush, or Majestic. They flag toxic links, identify anchor text imbalances, and map which pages have authority and which are starving. If a consultant skips this step and goes straight to outreach, that’s a reseller, not a strategist.

2. Competitor Gap Analysis

They identify the domains linking to your top three competitors but not to you. This isn’t just running a “link intersect” report, that’s the starting point. The real work is judging which of those domains are worth pursuing, which are paid placements dressed up as editorial, and which have already churned out so many guest posts the relevance is gone.

3. Prospect Qualification

This is where consultants earn their fee. A good consultant qualifies every target against a checklist: topical relevance, organic traffic (not just DR), recent posting frequency, outbound link patterns, and whether the site has been hit by a Helpful Content update. Most “agencies” skip this, and you end up with links from sites that haven’t ranked since 2022.

4. Outreach and Negotiation

They write the pitches, manage the inbox, negotiate placement terms, and handle the back-and-forth on content edits. Quality consultants own the email account they pitch from, they don’t blast from a generic @gmail address that gets flagged as spam by every WordPress ****SECRET_REDACTED**** in the country.

5. Reporting and Anchor Discipline

Every placement gets logged with the URL, anchor text, target page, referring domain metrics, and (this matters) the date the link went live. Anchor text distribution gets reviewed monthly to prevent over-optimization. A consultant who can’t show you their anchor text spread across the last 12 months isn’t tracking it.

link-building-consultant-workflow-five-stages
The audit and the reporting bookend the work. Skip either, and outreach quality drops within two months.

What a Consultant Should NOT Be Doing

Scope creep is the fastest way to waste consultant budget. If your consultant is also writing your blog posts, fixing your technical SEO, running your PR, and managing your social, you don’t have a consultant. You have a part-time generalist, and the link building is the first thing that suffers.

A link building consultant should not be:

They can advise on what content earns links and even brief your writers, but writing 2,000-word guides isn’t their job. That’s a content marketer.

Managing Your Technical SEO

Crawl budget, schema, internal architecture, these influence link value but they’re a separate discipline.

Running Digital PR Campaigns

These overlap, but PR is its own craft with different KPIs, different relationships, and different timelines.

If a consultant offers PBN access, walk. That’s a manual penalty waiting to happen.

The clearest scope a consultant should own: backlinks earned through editorial outreach, broken link building, resource page placements, unlinked mention reclamation, and HARO-style expert sourcing. Everything else is either a different role or a different vendor.

2026 Pricing Reality: What Consultants Actually Charge

The pricing gap is wider than most buyers realize. Here’s what we see across the consultant market in 2026:

Model Typical Range What You Get Best For
Hourly $150, $400/hr Strategy, audits, training your in-house team One-off projects, link strategy reviews
Per-link $200, $900/link Quality varies wildly by price tier Predictable budget, defined link goals
Monthly retainer $3,000, $12,000/mo Full strategy + execution + reporting Sustained campaigns, 6+ month commitment
Project-based $5,000, $25,000 Defined deliverables, fixed timeline Campaign launches, link cleanup projects
Hybrid (base + per-link) $1,500 base + $300, $600/link Strategy baseline plus volume flex Variable monthly link targets

The per-link pricing tiers tell you something specific. Anything under $200 per link is almost certainly resold from a vendor like FATJOE or The Hoth, you’re paying a markup on a commoditized product. The $400, $700 range is where competent editorial outreach lives. Above $900 and you’re either paying for genuinely high-authority placements (think DR 80+ trade publications) or you’re being overcharged.

link-building-consultant-pricing-models-2026
Hybrid pricing aligns consultant incentive with placement volume, without pushing them toward easy, low-quality targets.

Across link campaigns we’ve run for B2B SaaS clients, the most cost-effective structure has been a hybrid retainer: a $2,000, $3,000 monthly base that covers strategy, audits, and prospect research, plus a per-link fee that aligns the consultant’s incentive with placement volume. Pure per-link tends to push consultants toward easy, low-quality targets. Pure retainer can let momentum slow.

14 Questions That Expose Resellers in 30 Minutes

Most consultants pass the first 10 minutes of a discovery call. The next 20 minutes are where you find out who actually does the work. Run through these questions before you sign anything.

Strategy and Process

  1. Walk me through your prospect qualification checklist. What disqualifies a domain?
  2. How do you decide which of my pages to build links to first?
  3. What does your anchor text distribution look like across a typical 6-month campaign?
  4. Show me three placements you got for a client in the last 90 days.

Execution

  1. What email account do you pitch from, mine, yours, or a generic outreach domain?
  2. What’s your response rate, and how do you measure it?
  3. How do you handle a publisher asking for payment? Walk away, negotiate, or pay?
  4. Do you use any automation tools for outreach, and what’s the human-in-the-loop?

Quality Control

  1. What’s your replacement policy if a link gets removed or de-indexed within 90 days?
  2. How do you verify a target site’s traffic is real, not bot or expired-domain inflated?
  3. What’s the lowest-quality placement you’ve ever delivered, and why?

Reporting and Accountability

  1. Send me a sample monthly report from a current client (redacted is fine).
  2. How often do we talk, and what’s the agenda?
  3. What’s the one metric you’d let me fire you over if you miss it?

The last question is the most useful one. A consultant who answers “I don’t make guarantees” without giving you a single accountability metric is hedging. A good answer sounds like: “If I don’t deliver at least eight qualified placements averaging DR 40+ within the first 90 days, you don’t pay the next month.”

Red Flags: When to Walk Away

Four signals mean the consultant is reselling or worse, regardless of how polished the pitch deck is.

link-building-consultant-red-flags-warning-signs
Any one of these is enough to walk. Two or more and you’re being sold something other than link building.

1. They won’t show you live placements. Every legitimate consultant has clients who would let them share recent wins. If they cite NDAs across the board, they’re either inexperienced or hiding placements they’re not proud of.

2. They quote DR or DA without organic traffic. Domain Rating means nothing if the site has no real audience. A site can sit at DR 70 and pull 200 visits a month. Ask for both metrics on every prospect.

3. They guarantee specific rankings. Nobody can guarantee rankings. Anyone who does is either lying or planning to use tactics that will eventually trigger a manual action.

4. The price feels like a deal. A consultant quoting $500/month for “10 high-quality links” is reselling Fiverr gigs with a markup. The math doesn’t work otherwise, competent outreach takes 3, 6 hours per qualified placement, and no one’s labor is worth $8/hour.

One more pattern worth flagging: consultants who promise “AI-powered outreach at scale.” Outreach automation has its place, but at scale it produces the kind of pitch quality publishers delete on sight. The link building craft is still human-relationship work. Be skeptical of anyone selling otherwise.

Consultant vs. Agency vs. In-House: Which Model Fits

The right structure depends on three variables: your monthly link volume, your in-house bandwidth, and whether your competitive advantage is in execution or strategy.

Hire a Consultant When:

  • You need 5, 20 qualified placements per month
  • You have someone in-house who can brief, review, and act on the consultant’s reporting
  • Your strategy needs a senior brain, not a fulfillment team
  • You want one accountable owner, not an account manager layer

Hire an Agency When:

  • You need 30+ placements per month consistently
  • You want link building bundled with content production, technical SEO, and digital PR
  • You have budget above $10K/month and need redundancy if one person leaves
  • Your team can’t manage a vendor relationship beyond high-level reviews

Build In-House When:

  • Link building is a core, ongoing strategic function (publishers, marketplaces, large SaaS)
  • You can afford a $90K+ specialist plus tooling ($500, $1,500/month in Ahrefs, Pitchbox, etc.)
  • You have enough proprietary data, research, or product news to fuel earned-link campaigns
  • You need link velocity and editorial control coordinated tightly with content production

Most B2B SaaS companies between $5M and $50M ARR land on the consultant model for a reason, it’s the cleanest cost-to-quality ratio when you need senior strategic input but don’t have agency-scale volume needs. For a fuller breakdown of what to expect from contracted help, our contextual link building services guide covers placement quality benchmarks in detail.

How to Structure the First 90 Days With a New Consultant

The first 90 days set the relationship. Get this wrong and you’ll spend the next year fighting about deliverables. Get it right and you build a partner.

Days 1, 14: The consultant runs a full backlink audit on your domain, plus competitor gap analysis on three named competitors. They deliver a written strategy document with target pages, anchor text plan, and prospect criteria. You approve or revise. No outreach yet.

Days 15, 45: First outreach wave. Expect 2, 4 placements live by day 45, fewer if your domain is new, more if you have existing authority. You review each placement before it’s pitched, not just after it lands.

Days 46, 90: Cadence stabilizes. By day 90, you should have 6, 12 placements live with a clean anchor text distribution. The consultant delivers a 90-day retrospective comparing actual results to the original strategy doc. This is your decision point on whether to extend, renegotiate, or part ways.

The biggest mistake new clients make is expecting volume in the first 30 days. Editorial outreach is slow at the start because the consultant is building publisher relationships from scratch on your behalf. Volume compounds month four onward. If you cut the engagement at day 60 because “results are slow,” you’ve prepaid for ramp-up and walked away before the compounding kicks in.

What Good Reporting Looks Like

You should never have to ask a consultant “what did we get this month.” A competent monthly report includes:

  • Every new link placed (URL, target page, anchor text, referring domain DR, referring domain traffic, date live)
  • Outreach volume (pitches sent, response rate, conversion rate to placement)
  • Anchor text distribution across the trailing 6 months
  • Top-of-funnel prospect pipeline (qualified targets identified, in negotiation, declined)
  • Notable observations, publishers who responded well, niches that are saturating, content gaps blocking link earnability
  • Next month’s priorities and target pages

If the report is a screenshot of an Ahrefs backlink chart with no commentary, you’re not getting consulting, you’re getting fulfillment. The interpretation is the product.

Links still matter. Anyone telling you otherwise hasn’t looked at a SERP recently. What’s changed is that link quality compounds harder than it used to. Google’s Helpful Content System and SpamBrain have systematically devalued the kind of low-quality placements that used to move the needle. A consultant who’s still pitching directory submissions and PBN insertions is operating from a 2018 playbook.

The work that actually moves rankings in 2026 looks more like this: securing genuine editorial coverage on industry publications, earning links to data-driven research pages, reclaiming unlinked mentions on high-authority sites, and building topical authority through clusters of relevant placements rather than scattered high-DR drops. Our practitioner’s guide to link building in 2026 walks through the tactics that hold up under current algorithm conditions.

A good consultant knows which of these to prioritize based on your specific niche, competitive set, and content inventory. A reseller doesn’t make that distinction, they execute the same playbook regardless of client.

Frequently Asked Questions

Expect 30, 45 days before the first placements go live, and 90, 120 days before you see ranking movement. Editorial outreach is relationship work, pitches go out, publishers respond on their schedule, and content gets edited and published over weeks. Anyone promising faster results is either reselling pre-built placements or using tactics that won’t hold up.

A consultant owns strategy, execution, and reporting end-to-end, typically at $3K, $12K per month. A freelancer usually executes specific tasks like outreach or prospect research at hourly rates. Consultants advise on what to do; freelancers do what they’re told. The price difference reflects who owns the strategy.

For most B2B companies needing 5, 20 placements monthly, yes. Above 30 placements per month, the workload exceeds what one person can deliver at quality. At that point, you need either a small consulting team or an agency model with multiple specialists.

Hybrid pricing works best for most clients, a smaller monthly base (covering strategy, audits, reporting) plus a per-link fee for actual placements. Pure per-link pushes consultants toward easy, low-quality targets. Pure retainer can let urgency slip. Hybrid aligns incentives without creating either failure mode.

Three matter most: qualified placement volume (links from sites with real traffic and topical relevance, not just high DR), anchor text health (natural distribution, not over-optimized), and target page authority growth (the pages you’re building links to should gain organic traffic over 90, 180 days). Generic backlink count is the worst metric, it rewards volume over quality.

Is it safe to hire a consultant from a low-cost market?

Geographic arbitrage works in some functions. Link building isn’t usually one of them. Outreach quality depends on writing pitches that sound like a peer talking to a publisher in your market, which is harder when the consultant isn’t native to that market. There are exceptions, but vet harder than you would for a local hire.

Some specialize in link cleanup and reconsideration work, but it’s a different skill set than acquisition. If you’re recovering from a penalty, ask specifically for consultants with documented disavow and reconsideration experience. Don’t assume an acquisition specialist can handle cleanup.

Placements they secured for you stay live as long as the publisher keeps the content up. The consultant doesn’t “own” your links, you do. That said, the relationships they built with publishers leave with them, so a new consultant essentially starts the rolodex from scratch.

Hiring the Right Consultant

The consultants worth hiring share three traits: they qualify ruthlessly, they report transparently, and they say no to placements that won’t help you. The ones to avoid promise volume, hide their process, and quote rankings.

Run the 14 questions. Ask for three live placements from the last 90 days. Structure the engagement so the first 90 days have clear deliverables and a clean exit if it’s not working. Most importantly, treat the consultant as a partner who needs context from you, not a vendor you can throw a brief at and ignore for a quarter.

If you want a deeper read on what separates earned links from purchased ones, our breakdown of editorial link building that earns real authority covers the placement criteria that hold up across algorithm updates.

How to Do Link Building in 2026: A Practitioner’s Guide

link-building-system-five-stage-workflow

Most link building advice you’ll find online is recycled from 2018. Skyscraper this, broken link that, send 500 cold emails and pray. It doesn’t work anymore, and honestly, it barely worked then. The teams winning at link building in 2026 treat it less like an SEO checkbox and more like a small PR operation: tight prospecting, real assets, personalized outreach, and ruthless qualification of every site they pitch.

This guide walks through how to do link building the way working practitioners actually do it. No theory padding. No “what is a hyperlink” detour. If you’re past the basics and want a system you can run on Monday, start here.

What You’ll Learn

  • The 5-stage link building system that replaces spray-and-pray outreach
  • How to qualify a link target in under 90 seconds (and why most teams skip this)
  • The four asset types that earn links in 2026, and the two that stopped working
  • Pitch structures that get reply rates above 15% without sounding like a template
  • How to measure link building beyond referring domains (the metrics that actually predict rankings)
How To Do Link Building, link-building-system-five-stage-workflow
Link building is a system, not a tactic. Each stage compounds the next.

Here’s the pattern we see across hundreds of B2B campaigns: a team decides they need backlinks, opens Ahrefs, exports a list of 800 sites, and starts blasting outreach to anyone with a contact form. Reply rates land at 1, 2%. Link placement rate sits below 0.5%. After three months, the team has 4 links from sites nobody respects and concludes “link building doesn’t work for us.”

Link building works. Volume-first link building doesn’t. The shift since 2023 is straightforward: editors get hundreds of pitches a week, Google’s algorithms penalize irrelevant link patterns more aggressively, and AI tools have made generic outreach trivially easy to spot. What earns links now is the opposite of what most teams do, fewer prospects, deeper qualification, sharper pitches.

If you want to understand the strategic shift before getting tactical, our breakdown of the real benefits of link building covers why it still drives growth when done right.

Stage 1: Build Something Worth Linking To

You can’t outreach your way to authority with a thin “10 tips” blog post. Every campaign that consistently earns links starts with a linkable asset, a piece of content or tool that gives journalists, bloggers, and resource page editors a reason to cite you instead of someone else.

Four asset types still earn links reliably in 2026:

Original Research and Survey Data

This is the highest-use asset type. Survey 200+ practitioners in your category, publish the findings with clean charts, and pitch the data to journalists who cover that beat. A single original data point, “47% of B2B marketers can’t name their top AI search competitor”, can earn 30+ editorial links across 12 months because it gets cited and re-cited.

The investment is real (figure $3K, $15K for a credible survey), but a strong study produces links and citations for years. Backlinko’s own ranking factors studies earned tens of thousands of links over a decade. That’s not an outlier, it’s what data-led content does.

Free Tools and Calculators

Tools earn links passively because they solve a recurring problem. Anyone writing about your topic eventually needs to reference a calculator, a checker, or a generator, and they link to the best free option. Build the tool, rank it for the relevant query, and links arrive without outreach.

The catch: the tool has to actually work, look professional, and solve a real problem. A janky calculator with three input fields won’t earn anything.

Definitive Guides on Underserved Topics

Pick a topic in your space where every existing guide is either thin, outdated, or behind a paywall. Spend the time to write the version people will cite as the reference. Then pitch it to anyone who’s linked to the weaker existing guides, a tactic that still works because the value swap is obvious.

Visual Assets and Data Visualizations

Maps, custom charts, interactive comparisons. Journalists love embedding visuals because it saves them work and makes their article look better. A single well-designed visual can earn 20+ links if it gets picked up by the right outlet.

link-building-asset-types-effort-vs-links-matrix
Visual assets and tools punch above their weight, start there if your budget is tight.

Two asset types that stopped working: generic “ultimate guides” that just repackage existing content, and listicle-style “X tools for Y” posts written purely for link bait. Editors have seen 10,000 of these. They don’t respond.

Stage 2: Prospect Sites That Actually Matter

The size of your prospect list matters less than its precision. A focused list of 80 highly relevant sites will outperform a list of 800 generic ones every single time. Build prospect lists from these five sources:

Pull the referring domains of 3, 5 direct competitors. Filter for sites that link to multiple competitors but not you, these are the highest-probability targets because they’ve already proven they cover your space.

2. Topic-Specific Search Operators

Use queries like intitle:”your topic” + “resources”, “your topic” + “best of”, and “your topic” + inurl:links to surface resource pages and roundups that are already curating links in your category.

3. Journalist Databases

Muck Rack, Prowly, and Roxhill let you find journalists who’ve written about your exact topic in the last 90 days. These are warm targets, they’re actively covering the beat.

4. HARO / Connectively / Qwoted Requests

Source requests from journalists who explicitly want expert input. Reply rate on these is dramatically higher than cold outreach because they asked first.

5. Unlinked Brand Mentions

Sites already mentioning your company without a hyperlink are the lowest-friction wins of the entire campaign. Find them, send a friendly note, get the link added. Our guide on how to find unlinked brand mentions walks through the exact workflow.

Build the prospect list in a spreadsheet with these columns: domain, contact name, contact email, relevance score (1, 5), authority indicators (organic traffic, referring domains), and the specific angle you’ll pitch. If you can’t fill in the angle column, the site doesn’t belong on the list.

Stage 3: Qualify Every Target in Under 90 Seconds

This is the stage most teams skip, and it’s the single biggest predictor of campaign success. Before you add a site to your outreach list, run it through a fast qualification check. If it fails any of these, drop it.

link-target-qualification-checklist-pass-fail
Ninety seconds of qualification saves three weeks of pointless outreach.
Check Pass Fail
Topical relevance Site has published 5+ articles on your specific topic in the last 12 months Site is a generalist that happens to have one post in your space
Organic traffic Above 1,000 monthly organic visits (per Ahrefs/Semrush) Sub-500 monthly organic visits, likely dead or PBN-adjacent
Outbound link pattern Links to other reputable sites in your category Heavy outbound links to gambling, crypto, or unrelated niches
Recent activity Published in the last 60 days Last post was 8 months ago, abandoned site
Editorial signals Real author bylines, about page, masthead Anonymous posts, no author info, no contact details

Run this check fast. The goal isn’t a perfect score, it’s catching the obvious disqualifiers. If a site has zero organic traffic and links out to crypto casinos, it’s wasting your outreach budget regardless of its domain rating.

The Authority Signal Nobody Talks About

Domain Rating and Domain Authority are convenient but increasingly misleading. A DR 70 site that publishes 40 sponsored posts a month is worth less than a DR 45 site with a real editorial team. The signals that actually predict link value: real journalists on staff, a clear editorial standard, links to and from other respected sites in the category, and consistent original reporting. Trust your eyes more than the metric.

For a deeper read on how third-party authority metrics can mislead, our breakdown of how most SEOs misread Trust Flow and Citation Flow covers the common interpretation mistakes.

Stage 4: Send Pitches That Don’t Sound Like Pitches

The average cold outreach reply rate sits around 8%. The teams hitting 15, 25% do four things differently.

1. Personalize the First Two Sentences for Real

Not “I loved your post on X” personalization. Real personalization. Reference a specific argument they made, push back on it, agree with it for a specific reason, or connect it to something they wrote three years ago. The first two sentences prove you read their work. Everything after is allowed to be more standard.

2. Lead With What You’re Offering, Not What You’re Asking

The worst outreach opens with “I’m reaching out because we just published an article on X and thought it’d be a great fit for your site.” That’s the writer’s need, not the editor’s. Flip it: “Your piece on X mentioned that data on Y is hard to find. We just ran a survey of 340 practitioners on exactly that question, happy to send the raw data and a quote if useful.”

3. Make the Ask Small and Specific

“Would you consider linking to our guide?” is vague and asks for a decision. “If you update the post, this stat might be useful in paragraph 3, feel free to use it with or without a link” is concrete and gives away value before asking for anything. The second approach gets more links because it doesn’t feel like a transaction.

4. Keep the Email Under 120 Words

Editors scan on mobile. A 400-word email gets archived. A 90-word email with one clear ask gets a reply.

Here’s the structure that works:

  • Sentence 1: Reference something specific they wrote
  • Sentence 2: Connect it to a piece of value you have
  • Sentence 3: Briefly describe the value (data point, asset, quote)
  • Sentence 4: Make a small, specific ask
  • Sentence 5: Sign off, no pressure, no follow-up threats

Follow-Up Cadence

One follow-up after 5, 7 days. That’s it. Two follow-ups is acceptable if you have genuinely new information to add (“I noticed you just published another piece on this, same offer stands”). Three or more reads as desperate and damages your sender reputation.

personalized-vs-generic-link-building-outreach-email-comparison
The personalized version isn’t longer. It’s just written for the editor, not for you.

Stage 5: Track What Actually Predicts Rankings

Most link building reports show one metric: referring domains gained. That number tells you almost nothing about whether the campaign worked. The metrics that matter:

Topically Relevant Referring Domains

Links from sites in your specific category, not generic high-DR sites

Anchor Text Distribution

Branded, partial-match, and natural-language anchors should dominate; exact-match anchors should stay under 10% of the profile

In-content editorial links beat sidebar, footer, and author-bio links by a wide margin

Organic Traffic to the Linked Page

The page should see ranking improvements within 60, 90 days of earning quality links; if it doesn’t, the links weren’t quality

Campaign-level health metrics that let you tune the system over time

Reply rate below 8% means the targeting or pitch is broken. Link placement rate below 30% of replies means the asset isn’t strong enough or the ask isn’t aligned with what editors want. Diagnose the specific failure, fix it, run the next batch.

What to Skip Entirely

A few tactics are still everywhere in link building content. They don’t work, or they actively hurt you in 2026:

  • Mass guest posting on low-quality blogs. Google’s link spam systems flag these patterns. Strategic guest posts on genuinely respected publications are different, those still work.
  • Paid link networks and PBNs. Short-term lift, long-term penalty risk. Not worth it.
  • Reciprocal link exchanges at scale. Three-way and four-way exchanges are equally trackable. Google sees the pattern.
  • Comment links and forum signature links. Time sink. Zero impact.
  • Generic “skyscraper” outreach. The original tactic worked because nobody else was doing it. Now everyone is. The reply rates have collapsed.

If a tactic feels like a shortcut, it probably is. Real link building takes time because real relationships and real authority take time.

Realistic Timelines and Expectations

One thing nobody tells you when you start: link building results compound, but they compound slowly. Here’s what realistic looks like for a focused B2B campaign:

Timeframe Realistic Outcome
Month 1 Asset built, prospect list compiled, first 50 pitches sent, 2, 5 links secured
Month 2 Outreach refined based on reply patterns, 8, 15 cumulative links
Month 3 First ranking movements visible, 15, 25 cumulative links, referral traffic starting
Month 6 30, 60 cumulative editorial links, target pages climbing in SERPs, compounding effect kicking in
Month 12 Sustained authority growth, brand starting to appear in editorial coverage you didn’t pitch

Teams that quit at month 2 because “it’s not working” miss the inflection point that happens around month 4, 6. The links you place in month 1 don’t deliver their full ranking impact until months later. Plan for the compound curve, not for instant returns.

Link building takes 3, 6 months to show meaningful ranking impact because earned links compound over time. Most teams quit before month 4, which is exactly when the inflection point usually hits.

Frequently Asked Questions

There’s no fixed number, it depends on your competition’s link profiles. Pull the top 10 ranking pages for your target keyword and look at the median number of referring domains they have. That’s roughly the threshold you need to hit, plus topical relevance and content quality. For most B2B keywords, 30, 80 quality referring domains to the target page gets you into the running.

Strategic guest posting on respected industry publications still works well. Mass guest posting on low-quality “guest post networks” doesn’t and can trigger penalties. The rule: would you be proud to have this byline on your LinkedIn? If yes, it’s a real guest post. If no, skip it.

Expect 60, 90 days between earning a quality link and seeing the ranking lift it produces. Campaign-level results compound over 6, 12 months. Anyone promising faster results is either lying or building links that won’t last.

No. Paid links violate Google’s guidelines, the quality is almost always poor, and the link profiles look identical across hundreds of buyers, which makes them easy to detect algorithmically. The short-term lift isn’t worth the long-term risk to the domain.

Earning links means creating something so useful that people link to it without being asked, usually tools, original research, or definitive guides. Building links means active outreach to acquire links. Most successful campaigns combine both: build assets worth earning links to, then promote them through targeted outreach.

Yes, more than people think. Nofollow links drive referral traffic, build brand awareness, get cited by other journalists, and contribute to the overall authority signal Google measures. They don’t pass direct PageRank, but they’re part of a healthy, natural-looking link profile.

How do I find unlinked brand mentions?

Set up alerts for your brand name in Google Alerts, Mention, or BrandMentions. Filter for mentions on sites that don’t currently link to you, then send a polite note to the author asking if they’d consider adding the hyperlink. Conversion rates on this tactic are typically 30, 50% because the editor has already cited you.

Start With One Asset, One List, One Pitch

Most teams overthink link building until they’ve planned themselves out of starting. The simpler move: pick one asset you can build in the next two weeks, prospect 50 highly relevant sites, qualify them tightly, and send 50 personalized pitches. Track reply rate and placement rate. Adjust. Run the next batch.

The teams winning at this in 2026 aren’t doing anything magic. They’re just running the system consistently while everyone else is chasing the next shortcut. Pick the boring, slow path. It works.

If you want to go deeper on the strategic side of link building, what types of links to prioritize, how to think about anchor text, and how to build a profile that holds up over time, our practitioner’s guide on what link building actually is in 2026 covers the foundation. For teams that need execution help, our breakdown of editorial link building that earns real authority goes into the campaign-level work.

AI Visibility Diagnostic Framework: The 2026 Playbook

ai-visibility-diagnostic-framework-six-layers

Quick answer: Most brands trying to fix their AI visibility are guessing. They publish more content, rewrite a few pages, add schema, and wait. Three months later, ChatGPT still recommends their competitors. The problem isn’t effort, it’s diagnosis. An AI visibility diagnostic framework tells you exactly which failure mode is keeping you out of AI answers: entity conflicts, structural gaps, weak citation surface, or contradictory signals across the web. Once you know the cause, the fix is straightforward. Without a diagnosis, you’re guessing in a system that doesn’t reward guessing.

This guide gives you a working framework you can apply this week. Six diagnostic layers. A scoring rubric. Specific fixes per failure mode. And the honest order of operations, because most teams fix the wrong layer first and waste a quarter.

What You’ll Learn

  • The six diagnostic layers that decide whether AI cites you, and which one to test first
  • How to score each layer in under an hour using prompts, source checks, and entity audits
  • The five failure modes behind almost every “we’re invisible in ChatGPT” problem
  • What to fix in week 1, month 1, and quarter 1, in the right order
  • Why structural fixes compound and content-only fixes plateau
Ai Visibility Diagnostic Framework, ai-visibility-diagnostic-framework-six-layers
Each layer answers a different question. Start at the top, most teams skip ahead and misdiagnose the real problem.

Why a Diagnostic Framework Beats a Checklist

AI visibility is not a single metric. It’s the output of six independent systems behaving differently across engines. ChatGPT might cite you for one query and ignore you for the next. Perplexity might pull you from a Reddit thread. Gemini might surface a competitor because Google’s Knowledge Graph treats them as the canonical entity in your category.

A checklist treats this like a content problem. It isn’t. It’s a diagnosis problem. The same symptom, “AI doesn’t recommend us”, has at least five distinct causes, and the fix for each is different. Publishing more content fixes one of them. The other four get worse if you publish into a broken foundation.

The framework below isolates each cause. Run it once and you’ll know whether you have an entity problem, a structure problem, a content problem, a citation problem, or an engine-disagreement problem. Then you can fix the right thing.

The Symptom-to-Cause Gap

Here’s what makes this work different from SEO auditing. In SEO, the symptom (low ranking) usually points to a small set of well-understood causes: weak backlinks, thin content, technical issues, intent mismatch. In AI visibility, the symptom is identical across causes. “We don’t show up in ChatGPT” can mean any of these:

  • Your brand entity is ambiguous. AI doesn’t know which company you are
  • Your content exists but isn’t structured in a way AI can extract
  • Your content is structured but lives on surfaces AI doesn’t index well
  • You’re cited by AI, but the engines disagree about what you do
  • You have all of the above working, but a competitor has stronger third-party validation

Each of these requires a different fix. The framework tells you which one you have.

The Six Diagnostic Layers

Run these in order. The order matters, fixes at lower layers compound, fixes at higher layers don’t compound if the lower layers are broken.

Layer 1: Prompt Surface. What AI Actually Says About You

Start with the symptom. Open ChatGPT, Perplexity, Gemini, and Claude. Run 15, 25 prompts a buyer in your category would actually ask. Not branded queries. Category queries.

ai-visibility-prompt-scorecard-by-engine
Score appearance rate per prompt across at least four engines. One engine isn’t a diagnosis.

For a project management SaaS, that’s prompts like: “What’s the best project management tool for marketing agencies?” / “Compare Asana and ClickUp for small teams” / “Which PM tool integrates best with Slack and HubSpot?”

Record three things for each prompt: Do you appear? In what position? Are you described accurately? Run the same prompt three times. AI responses vary. If you appear once out of three runs, that’s not visibility. That’s noise.

Score this layer on appearance rate, not just presence. Appearing in 80% of relevant prompts across engines is the bar. Most B2B brands score under 15%.

Layer 2: Engine Agreement. Do AI Systems Tell the Same Story?

For every prompt where you appear, capture how each engine describes you. Then compare. If ChatGPT calls you “a project management tool for enterprises,” Perplexity calls you “a task tracker for freelancers,” and Gemini doesn’t recognize you as a PM tool at all, you have an engine disagreement problem.

Engine disagreement happens when your entity signals are inconsistent across sources. One section of your site positions you for enterprise. Your G2 listing categorizes you as small business. Your founder’s LinkedIn says “for creative teams.” AI models pull from all of it and produce three different summaries.

This is the single most overlooked diagnostic. Brands obsess over getting cited and never check whether the citation tells the right story.

Layer 3: Hallucination and Guessing Check

When AI doesn’t have enough signal about your brand, it guesses. Sometimes the guess is close. Often it’s wrong, wrong pricing, wrong customer segment, wrong features, wrong founding year.

Hallucination is a structural symptom, not an AI failure. It means the model couldn’t find authoritative content fast enough and reached for adjacent patterns. Fix the underlying gap and the hallucination stops.

Test this directly: ask each engine “What does [your company] do?” / “Who are [your company]’s customers?” / “How does [your company] price?” If the answers vary or invent details, log every hallucinated claim. Each one points to a missing or weak authoritative source.

Layer 4: Structural Readiness

Now you’re checking your own site. The question: can AI crawlers and retrievers actually read and extract from your content?

Check these specifically:

  • Crawl access: Are GPTBot, ClaudeBot, PerplexityBot, and Google-Extended allowed in robots.txt? Many companies block them by default and don’t know it.
  • Content surface: Is your expertise locked inside PDFs, gated downloads, or JavaScript-rendered pages? AI crawlers struggle with all three.
  • Schema: Organization, Product, FAQPage, and Article schema present and accurate on relevant pages?
  • llms.txt: Do you have one? If not, you’re leaving extraction guidance on the table. Our guide on how to write llms.txt for AI search walks through the format.
  • Answer-first formatting: Do your key pages lead with a direct, extractable answer in the first 100 words, or do they warm up for three paragraphs?

This layer is where most teams have the fastest wins. Structural fixes don’t take months, they take a week. And they unlock everything above.

Layer 5: Semantic Clarity and Entity Resolution

Does the open web know who you are as an entity? This is where entity SEO meets AI visibility.

Check these signals:

  • Wikipedia or Wikidata entry, if your category supports one
  • Consistent company name, founding year, and category across G2, Crunchbase, LinkedIn, and your own About page
  • A clear, repeated category descriptor across third-party sources (“marketing analytics platform”, not “platform” on one site, “tool” on another, “software” on a third)
  • Founder and key executive profiles linked to the company entity

If three different sources describe you three different ways, AI will pick whichever description is most reinforced, which is almost never the one you want.

Layer 6: Trust and Citation Surface

This is the foundation. AI engines weight sources by perceived authority and topical relevance. Your citation surface is the set of third-party publications, communities, and references where your brand appears in context.

ai-visibility-diagnostic-layers-foundation-to-surface
Bottom layers take quarters to build but compound. Top layers fix in weeks but don’t hold if the bottom is weak.

Audit specifically:

  • Editorial mentions in publications AI models actually index (industry trade publications, established business media, vertical authority sites)
  • Reddit threads, Quora answers, and community discussions where your brand is referenced. Perplexity weights these heavily
  • Comparison content on third-party sites (review platforms, “best of” roundups, alternatives pages)
  • Conference talks, podcast appearances, and named author bylines on authoritative sites

This layer compounds slowest and matters most. Brands with strong citation surfaces survive engine updates. Brands without them get displaced every time the underlying training data shifts.

Scoring the Framework

Each layer gets scored 0, 10. The composite score tells you where you stand. The individual scores tell you where to start.

Layer What 0 Looks Like What 10 Looks Like Fix Speed
Prompt Surface Zero appearances in 25 category prompts 80%+ appearance rate across 4 engines Symptom only, fix below
Engine Agreement Each engine describes you differently Consistent positioning across all engines 4, 8 weeks
Hallucination Check Wrong facts in 50%+ of responses Accurate facts in 90%+ of responses 2, 6 weeks
Structural Readiness Blocked crawlers, no schema, PDF-locked content Full crawl access, complete schema, answer-first content 1, 2 weeks
Semantic Clarity Inconsistent descriptions across third-party sources One clear category descriptor everywhere 6, 12 weeks
Trust Surface Zero editorial mentions on indexed publications Consistent mentions across 20+ relevant publications 3, 6 months

A score under 30 means you’re effectively invisible. 30, 50 means you appear inconsistently. 50, 70 means you’re competitive in some queries. Above 70 is rare and defensible.

The Five Failure Modes

Almost every diagnostic result maps to one of these patterns. Identify yours before you fix anything.

1. The Entity Conflict

Symptom: AI confuses you with another company, mislabels your category, or invents details that match a competitor.

Cause: Inconsistent or sparse entity signals across the open web. Often combined with a generic company name or a recent rebrand.

Fix: Layer 5 first. Reconcile your category descriptor across all third-party listings. Build out Wikidata if eligible. Make sure your About page, schema, and primary listings all use the same exact category language.

2. The Structural Lock

Symptom: You have great content but AI never cites it. Competitors with thinner content outrank you in AI responses.

Cause: Your best content is gated, PDF-locked, or buried behind JavaScript. Or you’re blocking AI crawlers without realizing it.

Fix: Layer 4. Audit robots.txt. Extract PDF expertise into HTML pages. Restructure flagship content to lead with extractable answers. This is the fastest-compounding fix in the framework.

3. The Citation Desert

Symptom: AI knows what you do but never recommends you. Competitors with similar features get cited regularly.

Cause: Weak third-party citation surface. AI engines need external validation to surface a brand confidently, your own site isn’t enough.

Fix: Layer 6. Build a real AI citation surface through editorial placements on publications AI models index. This is slow. Six months minimum. It’s also the most defensible result.

4. The Engine Split

Symptom: You appear in ChatGPT but not Perplexity, or in Gemini but not Claude. Each engine tells a different story.

Cause: Different engines weight different sources. ChatGPT leans on training data and a narrow set of high-trust sources. Perplexity leans on real-time web and community sources. Gemini leans on Google’s Knowledge Graph.

Fix: Diversify your surface. If you’re strong on owned content but weak on Reddit and Quora, Perplexity will miss you. If you don’t have a Wikidata or strong Google entity, Gemini will misclassify you. Our breakdown of how brand mentions work in AI search covers engine-specific weighting.

5. The Hallucination Pattern

Symptom: AI mentions you but invents details, wrong pricing, wrong features, wrong customers.

Cause: The model couldn’t find authoritative content for the specific question and filled the gap with adjacent patterns from competitors.

Fix: Identify the hallucinated claim. Find or create authoritative content that directly answers it. Make sure that content is structurally extractable (Layer 4) and reinforced by third-party citations (Layer 6).

The Right Order of Operations

This is where most diagnostic frameworks fail in practice. They tell you what’s wrong but not what to fix first. Here’s the order that compounds.

Week 1: Structural Readiness

Unblock crawlers. Add or fix schema. Extract PDF-locked content into HTML. Rewrite key landing pages with answer-first formatting in the first 100 words. Publish llms.txt.

This is the fastest layer to fix and it unlocks everything else. Skip it and every later fix underperforms.

Weeks 2, 4: Semantic Clarity

Audit how third-party sources describe you. Pick one canonical category descriptor. Update G2, Crunchbase, LinkedIn, your About page, your schema. Reconcile founder and exec profiles. If you qualify for Wikidata, file it.

Track entity consistency across at least 10 high-authority third-party sources.

Month 2: Hallucination Repair

Take every hallucinated claim from Layer 3. For each, create one authoritative page that answers the question directly, factually, and extractably. Reinforce with at least one third-party reference where possible.

Re-run Layer 3 prompts every two weeks. Hallucination rates drop within 30, 60 days when the underlying content gap is filled.

Month 3+: Citation Surface

Now build the trust layer. This is the longest fix and the one most teams want to do first. Don’t. Build it last. If you build citations into a broken foundation, the citations don’t compound, they get diluted by inconsistent signals at every other layer.

ai-visibility-diagnostic-90-day-timeline
Fix structure before semantics, semantics before content gaps, content gaps before citations. Reverse the order and you waste a quarter.

Target editorial placements on publications AI models actually index. Audit the Reddit and Quora surfaces in your category. Pursue named bylines and podcast appearances that reinforce your category positioning consistently.

What Most Teams Get Wrong

Three patterns keep showing up in audits.

They start with content. They publish 30 new pages while their crawlers are blocked and their entity signals contradict. Result: nothing changes.

They optimize one engine. They get cited in ChatGPT and assume the problem is solved. Then Perplexity drives a major buying decision and they’re nowhere to be found because they never built community-surface signals.

They confuse mentions with citations. A passing mention in a low-authority blog isn’t the same as a contextual citation in a publication AI models weight heavily. The difference shows up in your appearance rate, not your mention count.

The diagnostic framework catches all three. If you scored Structural Readiness at 4 and you’re hiring a content team, you’re solving the wrong problem.

How This Differs From an SEO Audit

SEO audits measure crawlability, rankings, backlinks, and on-page signals against Google. AI visibility diagnostics measure something different: whether your entity is legible, your content is extractable, your story is consistent across engines, and your citation surface is dense enough to survive engine updates.

You can pass an SEO audit and fail an AI visibility diagnostic. We see it constantly. A site with 80+ domain authority, great rankings, clean schema, and zero appearances in ChatGPT. The cause is almost always Layer 5 or Layer 6, strong owned signals, weak third-party reinforcement.

The reverse is also true. A site with mid-tier SEO metrics can dominate AI responses if its entity is sharp, its content is extractable, and its citation surface is dense in the right places.

If you’re auditing both, run them separately. Combining them produces a checklist that fixes neither problem well.

Frequently Asked Questions

How long does the full diagnostic take to run?

A first-pass diagnostic across all six layers takes 4, 6 hours of focused work. Layer 1 (prompt testing) is the slowest because you need to run prompts across multiple engines and multiple times to control for variance. The rest, structural audit, entity check, citation surface review, moves faster once you know what to look for.

How often should I re-run the diagnostic?

Re-run Layers 1, 3 monthly. They’re symptom-level and drift quickly with engine updates. Re-run Layers 4, 6 quarterly. They change slowly and require deeper work to move. If you do a major rebrand, repositioning, or product launch, run the full diagnostic immediately afterward.

Which AI engine should I prioritize?

Prioritize by where your buyers actually research. For most B2B categories, that’s ChatGPT and Perplexity. For visual or local categories, Gemini matters more. For technical and developer audiences, Claude usage is growing fast. Don’t optimize for one engine, optimize for the engines your buyers use, then verify with the others.

Can I run this diagnostic on a competitor?

Yes, and you should. Run Layers 1, 3 on your top three competitors. You’ll learn which engines they’re winning, how they’re being described, and where their hallucination patterns are. That tells you exactly where your positioning has room to win, especially in share of voice across AI surfaces.

What if my appearance rate is zero?

Zero appearance rate almost always points to Layer 5 or Layer 6. Your entity is either invisible or unrecognizable to the engines. Start with Layer 4 to make sure nothing is structurally blocking AI crawlers, then move to Layer 5 to reconcile your entity signals. Citation surface (Layer 6) is the long fix, but without Layers 4 and 5 in place first, citations don’t compound.

Does this framework work for local businesses?

The structure works, but Layer 6 looks different. For local businesses, citation surface includes Google Business Profile consistency, local directory signals, and review platform presence. The diagnostic logic is identical, only the source set changes.

How does this connect to traditional brand monitoring?

Traditional brand monitoring tools track where your brand appears across the web. The diagnostic framework tells you whether those appearances translate into AI visibility. They’re complementary, monitoring tells you what’s happening, diagnostics tells you why and what to fix.

Run the Diagnostic This Week

Open ChatGPT today. Run 10 category prompts. Note where you appear, where you don’t, and what AI says about you when you do. That’s your Layer 1 baseline. The rest of the framework gives you the path from “we’re invisible” to “we’re cited consistently”, but it starts with knowing what’s actually broken.

The brands that will own AI search in 2027 aren’t the ones publishing the most content right now. They’re the ones running diagnostics, fixing the right layer first, and compounding their citation surface while everyone else is still guessing.

Want the full diagnostic worksheet with prompts, scoring rubric, and fix priorities? Get your free AI visibility audit and we’ll run the framework against your brand and your top competitors.

AI Visibility for DevTools: A 2026 Operator’s Playbook

developer-asking-ai-for-devtool-recommendations

Developers stopped Googling for tools two years ago. They ask Claude which auth library to use, ask Perplexity for the best vector database, ask ChatGPT to compare observability platforms. If your devtool isn’t in those answers, you’re not in the consideration set, and you’ll never know it happened.

Ai Visibility For Devtools, developer-asking-ai-for-devtool-recommendations
The citation list in an AI response is the new shortlist, and most devtools have no presence in it.

AI visibility for devtools is the practice of earning citations inside AI assistants when developers ask for tooling recommendations, comparisons, or implementation help. It runs on different signals than B2B SaaS visibility: GitHub presence, technical documentation depth, package registry authority, and Stack Overflow answers carry more weight than press mentions or thought leadership posts. Most generic AI visibility playbooks miss this entirely.

This is the playbook we’d hand a devtool founder or DevRel lead who wants to be cited by name when developers ask AI for recommendations in their category.

What “AI Visibility” Actually Means for Developer Tools

For B2B SaaS, AI visibility usually means showing up when a marketer asks ChatGPT for “best CRM for startups.” For devtools, the queries are sharper, more technical, and tied to specific stacks:

  • “What’s the best library for streaming LLM responses in Node?”
  • “Compare Resend vs. Postmark for transactional email”
  • “How do I add OAuth to a Next.js app, what should I use?”
  • “Which feature flag tool works best with Go microservices?”

These aren’t marketing questions. They’re implementation questions, and the AI is being asked to make a technical recommendation a developer will act on within minutes. The citation pool AI pulls from is also different. Generic AI visibility tools track mentions in Forbes, TechCrunch, and industry blogs. None of that moves the needle for devtools.

What does move it: GitHub README files, official docs, Stack Overflow accepted answers, dev.to posts, Hacker News threads, package registry pages (npm, PyPI, crates.io), and engineering blogs from teams the developer audience already trusts. That’s the source list. If your tool isn’t represented there, you don’t exist in AI answers.

Why Devtool AI Visibility Runs on Different Signals

Three things separate devtool AI visibility from generic B2B AI visibility, and getting these right is most of the work.

Documentation Is Your Highest-use Asset

For a marketing tool, the website’s blog and pricing page do the heavy lifting. For a devtool, the docs are the product surface AI models ingest most aggressively. Well-structured technical documentation, with code samples, API references, and clear use-case framing, gets pulled into AI responses constantly. Marketing copy doesn’t.

The docs that get cited share a few traits: they answer specific implementation questions in their headings, they include working code samples with multiple languages, and they explain *why* certain patterns are used, not just *how*. AI models prefer documentation that reads like a senior engineer explaining a concept to a peer.

GitHub and Package Registries Carry Authority Weight

A devtool with 800 GitHub stars, an active issue tracker, and weekly npm downloads in the tens of thousands is a different entity to an AI model than one with a polished landing page and no traction signals. AI assistants weigh adoption signals heavily when ranking technical recommendations, partly because that’s how their training data has been labeled, partly because RAG systems pulling current data lean on these signals too.

ai-recommendation-signals-for-devtools
Five signal sources feed devtool recommendations, and four of them aren’t on most marketing teams’ radar.

If your GitHub presence is a thin mirror repo with no community, the AI sees a tool nobody uses. That filters into answers.

Developer Communities Are Citation Engines

Stack Overflow, Reddit (specifically subs like r/programming, r/webdev, r/golang, and language-specific communities), Hacker News, and dev.to function as citation amplifiers. When a developer answers a question with “we use [Tool X] for this, here’s why,” and that answer gets upvoted, AI models register that signal. Repeat that across hundreds of organic mentions, and your tool becomes the default recommendation.

The reverse is also true. If your tool has visible community drama, unresolved bugs in active threads, or a pattern of negative comparisons, AI assistants surface that too, sometimes in the same response that recommends you.

The Five Signal Categories That Earn Devtool Citations

Across the devtool campaigns we’ve worked on, five signal categories consistently move citation rates. Skip any of them and the strategy underperforms.

Signal Category Why It Matters Where to Build It
Technical Documentation Highest-density source for implementation queries Your docs site, with structured headings and runnable code
Open Source Footprint Adoption signals AI weighs in ranking GitHub repos, issues, discussions, package registries
Community Discourse Organic mentions that compound over time Stack Overflow, Reddit, Hacker News, dev.to
Editorial Authority Trusted technical publications AI indexes deeply InfoQ, The New Stack, IEEE Spectrum, language-specific blogs
Structured Metadata Helps AI parse what your tool is and does Schema markup, llms.txt, OpenAPI specs, README structure

Each one needs a deliberate program. Treating them as marketing tactics, write a blog post, run a campaign, misses the point. These are infrastructure investments. They compound.

How to Build a Devtool AI Visibility Program

The right sequence matters. Most teams jump to community marketing without fixing their documentation, and they wonder why citations don’t follow. Build the foundation first.

Step 1: Audit Your Current AI Presence

Run 30, 50 queries across ChatGPT, Perplexity, Claude, and Gemini that a developer in your category would actually ask. Don’t ask “what is [your tool]”, that’s a vanity query. Ask the recommendation queries:

  • “Best [tool category] for [specific stack]”
  • “Compare [Competitor A] vs. [Competitor B]”
  • “How do I [specific implementation task]”
  • “Open source alternatives to [Competitor]”

Log which tools get cited, in what order, and what sources the AI references. This is your baseline. If you appear in fewer than 20% of relevant queries, you have a visibility problem regardless of how good your product is. Tracking brand mentions across AI search platforms systematically beats spot-checking by hand.

Step 2: Fix Your Documentation for AI Extraction

This is the highest-ROI work you can do, and most teams skip it. The fix isn’t rewriting your docs from scratch, it’s restructuring them so AI models can extract clean answers.

  • Use question-style headings for common implementation tasks (“How do I authenticate API requests?” not “Authentication”).
  • Open every section with a 1, 2 sentence direct answer before going into detail.
  • Include working code samples in the languages your audience uses, with comments that explain the *why*.
  • Add a comparison page that honestly shows when your tool fits and when it doesn’t. AI cites these heavily.
  • Publish an llms.txt file at your root domain pointing AI crawlers to your most important documentation. Writing llms.txt for AI search takes a couple hours and pays off for years.
documentation-restructured-for-ai-extraction
AI models extract from question-style headings far more reliably than noun-form section titles. The restructure usually takes a week.

Step 3: Build Strategic GitHub and Package Presence

If your tool is open source, this is mostly hygiene: clear README with installation, quick start, and use cases at the top; active issue triage; published changelogs; tagged releases. If your tool is closed source but has SDKs, the SDKs are your GitHub presence, treat them with the same care.

For closed-source tools without SDKs, build a public examples repo. Real working examples for the top 10 use cases of your product, in the languages your audience uses. AI models index these aggressively because they’re exactly the kind of code-with-context that answers implementation queries.

Step 4: Earn Mentions on Sources AI Actually Indexes

This is where most devtool marketing programs break down. Teams pitch TechCrunch and Forbes when AI models care more about a thoughtful post on dev.to from an engineer with 5,000 followers. The hierarchy for devtool citations roughly looks like this:

  1. Stack Overflow accepted answers mentioning your tool in context
  2. Hacker News front-page discussions (organic, not promotional)
  3. Engineering blogs from companies developers respect
  4. Dev community publications (dev.to, Hashnode, Lobsters)
  5. Technical publications (InfoQ, The New Stack, IEEE Spectrum)
  6. Language or framework-specific newsletters and blogs
  7. Conference talks with published transcripts or videos

Pitching the wrong publications wastes months. Community mentions services that understand developer audiences operate very differently from generic PR firms, the difference shows up directly in citation rates within 60, 90 days.

Step 5: Track, Iterate, Compound

Re-run your baseline queries every 30 days. Track citation rate, position in cited lists, and which sources AI is pulling from to mention you. The pattern you’ll see: citation rate moves slowly for the first 60 days, then accelerates as the signals you’ve planted start reinforcing each other. Most teams quit at day 45. The ones who push through see consistent recommendations by month 4.

Where Generic AI Visibility Tools Fall Short

If you’ve evaluated tools like Profound, Otterly, or Peec AI, they’re solid for B2B SaaS visibility but thin on devtool-specific signals. They track mentions in marketing publications well. They miss GitHub adoption signals, package registry authority, Stack Overflow answer dynamics, and the specific community sources where developer recommendations form.

devtool-ai-citation-rate-growth-curve
The compounding curve is real. Most teams quit at the flat part, the ones who don’t see acceleration around month 3.

DevTune is the most purpose-built option for the developer tool category right now, it tracks community discourse on GitHub, Hacker News, Stack Overflow, and dev.to alongside standard AI citation tracking. Worth evaluating if developer audiences are your entire focus.

For most devtool teams, the better move is a hybrid: a citation tracking tool that covers AI assistants broadly, paired with manual monitoring of the developer-specific sources that matter most for your category. Comparing AI visibility analytics tools against your specific signal needs is worth the afternoon it takes.

The Mistakes That Kill Devtool AI Visibility Programs

Five failure modes show up in nearly every devtool team that struggles with AI visibility:

1. Treating It as Marketing Instead of Infrastructure

AI visibility for devtools is a cross-functional program. DevRel, docs, engineering, and marketing all own pieces. If marketing runs it alone, the technical signals don’t get built.

2. Optimizing for the Wrong Sources

Pitching mainstream tech press while ignoring Stack Overflow, dev.to, and language-specific communities. The press placements feel important but barely move citation rates.

3. Skipping the Documentation Work

Docs are the highest-use asset and the most consistently neglected. A weekend of restructuring beats a month of content marketing.

4. Faking Community Presence

Astroturfed Reddit comments, fake Stack Overflow answers, paid Hacker News posts. AI models and human readers both detect these, and the brand damage outlasts the short-term lift.

5. Quitting Too Early

Citation rates compound, but the compounding kicks in around month 3-4. Programs killed at month 2 never see the return.

Frequently Asked Questions

How long does it take to see AI citations for a devtool?

Most devtools see early citation movement within 60-90 days of focused work, with consistent recommendations emerging around month 4. Tools with strong existing GitHub presence and documentation move faster, sometimes seeing citations within 30 days of an llms.txt and docs restructure. Net-new tools with no community presence take longer because adoption signals have to be built from zero.

Do GitHub stars actually influence AI recommendations?

Yes, indirectly but meaningfully. AI models don’t read star counts directly, but star counts correlate with the volume of community discussion, blog posts, and accepted Stack Overflow answers about a tool, and those are the sources that get cited. A tool with 5,000 stars typically has 50-100x the discussion footprint of a tool with 50 stars, and that footprint is what AI assistants pull from.

Is llms.txt worth implementing for devtools?

Worth implementing, not worth obsessing over. An llms.txt file pointing AI crawlers to your most important documentation pages takes a couple hours to write and is a clear positive signal. It won’t transform your visibility on its own, the underlying documentation has to be good, but combined with strong docs it accelerates AI extraction. Skip it only if you have nothing else to fix first.

Should we build SDKs even if our product is API-only?

If developer audience is core to your business, yes. SDKs give you a GitHub presence, get indexed by package registries, and create natural citation surfaces in code samples across the web. An API with no SDK is invisible to most of the citation pool that drives AI recommendations. Even thin client libraries in the top 3-4 languages your audience uses are worth the maintenance cost.

How do we track AI citations across multiple platforms efficiently?

Run a fixed query set monthly across ChatGPT, Perplexity, Claude, and Gemini, 30-50 queries that cover your category, comparisons, and implementation use cases. Log results in a spreadsheet or use a citation tracking tool that monitors AI assistants automatically. Spot-checking by hand works for early-stage teams; teams scaling beyond Series A usually need automated tracking to spot trends and competitor movement.

Does writing for Hacker News still work in 2026?

Writing *to* Hacker News rarely works. Writing things engineers want to share that happen to surface on Hacker News works extremely well. The pattern that gets cited: technical deep-dives, postmortems, novel benchmarks, and contrarian takes from credible engineers. Promotional posts get flagged and buried, and that signal sticks to your domain.

Where Devtool Visibility Programs Pay Off

The devtools that win the next five years won’t be the ones with the biggest marketing budgets. They’ll be the ones AI assistants recommend by default when a developer asks for tooling help, because their docs are extractable, their GitHub presence is real, their community signals are organic, and the editorial mentions they’ve earned come from publications AI actually trusts. That’s a different game than B2B SaaS marketing, and it’s not optional anymore.

Start with the audit. Run the queries, see where you stand, and pick the one signal category that’s weakest. Fix that first. The compounding starts the day you do.

Want help mapping your devtool’s AI citation gaps and the publications AI models pull from in your category? Get a free AI visibility audit built specifically for developer tool companies.

Google Ranking Dropped Dramatically? Diagnose & Fix Fast

google-ranking-dropped-dramatically-vs-normal-volatility-chart

Google ranking dropped dramatically, A dramatic Google ranking drop almost always traces to one of six causes: a core algorithm update, a technical change you (or a developer) shipped recently, a manual action, lost backlinks, a content quality reassessment, or a SERP layout shift that gutted clicks without moving rankings. The fix isn’t panic, it’s a 60-minute diagnostic that isolates which one hit you, in what order, and how deep the damage actually goes. Most teams skip the diagnostic and start changing things. That’s how a 30% drop becomes a 70% drop.

This guide walks through the exact sequence we use when a client’s traffic falls off a cliff. No checklist soup. No “it depends.” Just the order of checks that surfaces the cause fastest, with the recovery move that matches each one.

What “Dramatically Dropped” Actually Means

Before diagnosing anything, define the drop. Ranking volatility happens daily. A jump from position 4 to position 7 on a single keyword isn’t a crisis, it’s noise. A dramatic drop has three traits:

Google Ranking Dropped Dramatically, google-ranking-dropped-dramatically-vs-normal-volatility-chart
If your chart looks like the right side, you’re diagnosing a real event, not chasing daily noise.
  • Scale: 30%+ traffic loss across multiple pages, or 10+ position drops on commercial keywords that previously held top 5.
  • Speed: The fall happened inside a 1, 7 day window, not a slow bleed over months.
  • Breadth: Multiple URLs affected, not a single page that an aggressive competitor outranked.

If your situation matches all three, you’re dealing with a real event. If it matches one or two, you may be looking at content decay, a single-page issue, or normal SERP movement, different problem, different fix.

The 60-Minute Diagnostic: Run These Six Checks in Order

The sequence matters. Each check rules out a category of cause, so by check 6 you’ve isolated the real culprit instead of fixing things that weren’t broken.

Check 1: Verify the Drop Is Real (5 minutes)

Open Google Search Console. Compare the last 28 days against the previous 28. Look at clicks, impressions, average position, and CTR. Then cross-check in GA4 (organic search channel) and your rank tracker.

You’re looking for one of three patterns:

  • Clicks down, impressions down, position down: Real ranking drop. Keep diagnosing.
  • Clicks down, impressions stable, position stable: SERP layout change (AI Overview, new ad block, Featured Snippet someone else won). Different problem, see Check 6.
  • Clicks down, but only in your rank tracker: Tracking error. Fix the tool. Move on.

About one in five “dramatic drops” we get called about turn out to be tracking misconfigurations or SERP feature changes. Verify before you diagnose.

Check 2: Manual Action and Security (3 minutes)

In Search Console, open the Manual Actions and Security Issues reports. If either shows anything, stop diagnosing, that’s your cause. Manual actions are rare but unambiguous. Security issues (hacked content, malware, deceptive pages) hit rankings hard and fast.

Most sites will see “No issues detected” here. Good. Move on.

Check 3: Algorithm Update Timing (5 minutes)

Cross-reference the date of your drop against Google’s confirmed updates. The Google Search Status Dashboard lists every confirmed update. Tools like Semrush Sensor and Advanced Web Ranking also flag SERP volatility spikes.

google-algorithm-update-timeline-ranking-drop-correlation
If your drop date falls inside a confirmed update window, you’re working a content-quality problem, not a technical one.

If your drop aligns with a confirmed core update or spam update, within 24, 72 hours, you’re dealing with an algorithmic reassessment. This changes the fix entirely. Don’t make panic edits. Core updates evaluate site-wide quality signals, and the recovery is usually content-quality work, not technical patches.

If there’s no aligned update, skip to Check 4.

Check 4: Recent Site Changes (15 minutes)

This is where most drops actually live. Pull a list of every change to the site in the 14 days before the drop. Ask developers, content teams, and anyone with publishing access. You’re looking for:

  • Site migrations or platform changes (most common)
  • URL structure changes or redirect pushes
  • robots.txt edits
  • Canonical tag changes or noindex tags accidentally deployed
  • Template or theme updates that changed internal linking
  • JavaScript framework changes affecting how content renders for crawlers
  • HTTPS issues, certificate expiry, or server consolidation

Run a fresh crawl with Screaming Frog or Sitebulb. Compare against your last clean crawl. Look specifically for: noindex tags on pages that previously ranked, canonicals pointing to wrong URLs, internal links that now 404, and orphaned pages that lost their internal link equity.

One client came to us after a 60% traffic loss. The cause: a developer pushed a noindex tag to the staging environment, then the staging template got merged into production. Three thousand URLs went noindex overnight. Diagnosis took 12 minutes once we ran the crawl. Recovery took 10 days.

Check 5: Indexing and Crawl Health (10 minutes)

In Search Console, open the Pages report under Indexing. Compare indexed page counts against your previous baseline. A sudden drop in indexed pages is a flashing red light.

Then check:

  • Crawl Stats: Did Googlebot’s crawl rate fall off a cliff? Server issues or robots.txt blocks cause this.
  • Coverage report: Look for spikes in “Discovered, not indexed,” “Crawled, not indexed,” or “Excluded by noindex tag.”
  • URL Inspection on 5 affected pages: Are they still indexed? When were they last crawled? Is the rendered HTML the same as the source?

If pages dropped out of the index, you’ve found a likely cause. If they’re still indexed but ranking lower, the issue is relevance or authority, keep going.

The remaining causes need an external view.

google-ranking-drop-six-step-diagnostic-flowchart
Run the checks in this order. Each one rules out a category, so by check 6 the cause is usually obvious.

Backlink loss: Pull a fresh backlink report from Ahrefs or Semrush. Compare lost links over the last 30 days against your top-ranking pages. If a key page lost 5+ referring domains in the same week traffic fell, that’s likely the cause. Reach out to lost-link sites, replace what you can, and consider whether the loss reflects a broader trust signal shift.

SERP layout shift: Manually search 5 of your highest-traffic keywords. Compare what you see now to what was there 30 days ago (use Wayback Machine or your rank tracker’s SERP history). If AI Overviews now occupy the top of the page, if a new Featured Snippet appeared, if shopping results pushed organic below the fold, your rankings may not have moved at all. Your visibility did.

Competitor moves: Check who’s now outranking you. Did they publish something stronger? Did they earn major links? Did they restructure to capture intent better? If three competitors all moved up at once, it’s likely an algorithmic preference shift rewarding their pattern over yours.

Match the Cause to the Recovery Move

Once you’ve isolated the cause, the recovery is specific. Generic “improve your content” advice is what makes most recoveries take six months instead of six weeks.

Cause Recovery Move Realistic Timeline
Manual action Fix the violation, file reconsideration request 2, 8 weeks after fix
Hacked / security issue Remove malicious code, request security review 1, 4 weeks after clean
Recent technical change (noindex, robots, canonicals) Revert the change, request reindexing 3, 14 days
Site migration error Fix redirects, restore lost signals 4, 12 weeks
Core update reassessment Content quality work, E-E-A-T signals, trim weak pages 3, 9 months (next update)
Lost backlinks Recover lost links, rebuild with editorial outreach 2, 6 months
SERP layout shift (AI Overview, etc.) Restructure for extraction, target adjacent queries 1, 3 months
Competitor moved up Audit their new content, close the gap 2, 4 months

The Recovery Mistakes That Make Drops Worse

Most “recovery” work after a ranking drop is panic activity that buries the real cause. Don’t do these:

Don’t make sweeping changes before you know the cause. Editing 50 pages, changing your site structure, or disavowing links blindly during a drop adds new variables. Now when rankings move, you can’t tell which change caused what.

Don’t disavow without evidence. The disavow tool is for cases with confirmed manual actions or clear unnatural link patterns. Disavowing healthy links because traffic fell is a way to make a drop permanent.

Don’t republish everything with new dates. Updating the publish date doesn’t trick Google. Real content updates, adding new sections, refreshing data, fixing thin coverage, work. Cosmetic date changes don’t.

Don’t wait six months on a core update recovery without doing the work. Core updates don’t reverse on their own. The next update can confirm the demotion if quality hasn’t improved. You have to do the content work between updates.

Don’t ignore the bigger pattern. If this is your second or third drop in 18 months, the issue isn’t any single event, it’s a pattern. Audit your overall content strategy, not just the most recent drop.

How AI Search Changes the Recovery Math in 2026

One thing has shifted since 2024. When traditional rankings drop, it’s no longer just a Google traffic problem, it’s often a leading indicator that AI assistants stopped surfacing your brand too. ChatGPT, Perplexity, and Gemini lean on similar quality signals, and a site that loses Google trust often loses AI citation slots within the same window.

If you’re recovering from a core update reassessment, audit AI visibility in parallel. Ask the major AI assistants for recommendations in your category. If you’ve disappeared from those answers as well, the recovery work needs to address both surfaces, not just Google.

A dramatic Google ranking drop usually traces to one of six causes, a core update, a recent site change, a manual action, lost backlinks, a content quality reassessment, or a SERP layout shift. Run a 60-minute diagnostic in order before changing anything.

Related: entity SEO · brand mentions for SEO · what is link building

Frequently Asked Questions

How long does it take to recover from a dramatic Google ranking drop?

Recovery time depends entirely on the cause. Technical fixes (noindex, robots, canonicals) recover in 3, 14 days once corrected. Manual action recoveries take 2, 8 weeks after the violation is fixed and a reconsideration request is filed. Core update recoveries are the slowest, typically 3, 9 months, because they require waiting for the next update to confirm the quality work. Don’t trust anyone who promises faster recovery from a core update. The mechanism doesn’t allow it.

Can a single Google algorithm update wipe out a site’s traffic overnight?

Yes. Core updates and spam updates can cut traffic by 50% or more within 24, 72 hours of rollout. The drop reflects a site-wide reassessment of quality signals, not a single-page penalty. Recovery requires improving the underlying signals, content quality, E-E-A-T, topical authority, not patching individual pages.

Should I file a reconsideration request if my rankings dropped?

Only if Search Console shows a manual action. Reconsideration requests are reviewed by humans and only apply to manual penalties. Filing one for an algorithmic drop wastes your time and Google’s. Check the Manual Actions report first. No flag means no reconsideration request.

Why did my impressions stay stable but my clicks fall off a cliff?

That pattern means your rankings didn’t drop, your SERP did. Common causes: an AI Overview appeared above the organic results, a Featured Snippet got reassigned to a competitor, a video carousel or shopping block pushed your result below the fold, or new ads compressed organic real estate. The fix isn’t ranking recovery, it’s restructuring content for extraction (so you become the AI Overview source) or targeting adjacent queries that haven’t been compressed.

Is content decay the same as a dramatic ranking drop?

No. Content decay is a slow erosion over months as the SERP evolves, competitors publish stronger material, or topical freshness fades. A dramatic drop is a sudden event tied to a specific cause. Decay is fixed by content refreshes and depth additions. A dramatic drop needs the diagnostic above first, refreshing content while the real cause is a noindex tag wastes weeks.

Backlinks still carry strong ranking weight, but the bar is higher. Google now weighs editorial context, topical relevance, and source authority more than raw domain metrics. Lost backlinks from highly relevant editorial sources hurt more than lost links from generic high-DA sites. If your drop correlates with backlink loss, prioritize replacing links that match your topic cluster, not just rebuilding raw counts.

What’s the first thing to check when rankings drop?

Verify the drop is real. About 20% of reported “dramatic drops” are tracking errors, SERP feature changes, or normal volatility misread as a crisis. Compare Search Console clicks, impressions, and position over the last 28 days against the previous 28. Cross-check in GA4 and your rank tracker. Only diagnose causes if all three sources confirm the drop.

Run the Diagnostic Before Changing Anything

The teams that recover fastest aren’t the ones who work hardest after the drop, they’re the ones who diagnose before they fix. Run the six checks in order. Match the cause to the recovery move. Then do the work that matches the actual cause, not the work that feels productive. If you’re sitting on a drop right now, give yourself the next 60 minutes for diagnosis before you touch a single page. For a deeper look at the technical side of how Google’s crawl and indexing systems shape what ranks, our guide on building entity authority for 2026 search covers the signal architecture that compounds across drops and updates.

Generative Engine Optimization Tools: 9 Tested for 2026

generative-engine-optimization-tools-comparison-overview

Most generative engine optimization tools sell the same promise: track your brand across ChatGPT, Perplexity, Gemini, and AI Overviews, then “improve visibility.” The promise is identical. The execution isn’t even close. After running side-by-side tests across nine platforms over the past four months, the gap between what these tools claim and what they actually deliver is wider than any vendor comparison page admits.

This guide is for marketing leaders evaluating which generative engine optimization tools are worth the budget in 2026, and which ones are recycled SEO dashboards with an AI label slapped on top. You’ll get the testing notes, the pricing reality, the failure modes, and a clear answer for which tool fits which stage of team.

What You’ll Learn

  • Which 9 GEO tools we tested across ChatGPT, Perplexity, Gemini, and Google AI Overviews
  • The single capability that separates real GEO platforms from rebranded rank trackers
  • Pricing reality, entry tiers start at $99/month, enterprise hits $5,000+/month
  • Why prompt coverage matters more than model coverage (and how vendors hide this)
  • The right tool for your stage: pre-Series A, growth-stage, and enterprise
  • What to test in a 14-day pilot before signing any annual contract
Generative Engine Optimization Tools, generative-engine-optimization-tools-comparison-overview
Nine GEO tools, four AI surfaces, one honest comparison, here’s what actually separates the winners.

What Generative Engine Optimization Tools Actually Do

A generative engine optimization tool tracks how AI systems. ChatGPT, Perplexity, Gemini, Claude, Google AI Overviews, describe, cite, and recommend your brand when users ask buying-stage questions. The good ones go further: they tell you why you’re invisible and which sources AI models pulled from instead of yours.

The category sits in a strange place. Half the tools in the space are observability platforms, they show you what’s happening across AI surfaces. The other half are workflow platforms, they help you fix it. A few try to do both, and most do neither well.

Here’s what a real GEO tool needs to handle:

  • Prompt simulation at scale, running hundreds of unbranded buying queries against multiple models, multiple times, to capture variance
  • Citation tracking, identifying which sources AI models pull from when answering category questions in your space
  • Share of voice measurement, comparing how often you appear versus competitors across the same prompt set
  • Sentiment and context analysis, not just “are you mentioned” but “how are you described”
  • Diagnostic insight, explaining why visibility is low, not just reporting that it is

If a tool only does the first two, it’s a rank tracker with a new skin. The diagnostic and source-attribution layers are where the real money sits.

How We Tested These Platforms

The testing methodology mattered because most “best GEO tools” lists are built from feature pages and press releases. We ran the same evaluation across all nine platforms:

geo-tool-testing-methodology-prompt-coverage
Same prompts, same models, same eight-week window, testing rigor that most vendor comparisons skip entirely.
  1. Same prompt set, 50 unbranded buying-intent prompts in three verticals (B2B SaaS, fintech, healthtech)
  2. Same model coverage. ChatGPT (GPT-4o and GPT-5 where available), Perplexity, Gemini, Claude, Google AI Overviews
  3. Same time window, eight weeks of continuous tracking, August through October 2026
  4. Same diagnostic test, for each tool, can it explain why a brand isn’t being cited and recommend a fix
  5. Same export test, can the data leave the platform in a format your team can actually work with

Across hundreds of brand citation campaigns we’ve run, one pattern keeps showing up: tools that look identical in demos behave nothing alike when you run real prompt sets through them. The variance in results across platforms, for the exact same query, was over 40% in some cases. That’s not noise. That’s a category-wide methodology problem.

The 9 Generative Engine Optimization Tools Worth Considering in 2026

These are ranked by how well they fit a defined use case, not by which paid the loudest. The verdict at the end of each section tells you who should buy it and who shouldn’t.

1. Profound. Best for Enterprise Observability

Profound built its name on capturing real front-end conversation data rather than simulating prompts. The platform tracks citations across ChatGPT, Perplexity, Gemini, and Google AI Overviews using a dataset its team claims is sourced from hundreds of millions of real user interactions.

What works: Citation source attribution is the strongest in the category. When ChatGPT recommends a competitor and not you, Profound shows the actual URLs the model pulled from. That’s diagnostic gold. The Query Fanout feature also expanded coverage in mid-2026, surfacing the sub-queries AI systems run behind a single user prompt.

What doesn’t: Pricing starts around $4,000+/month for serious tier coverage. The interface is dense, and onboarding takes 2, 3 weeks before anyone on your team feels fluent. Smaller teams will drown.

Verdict: If you’re a Series C+ company with a dedicated AI visibility lead, Profound is probably your top pick. For everyone else, you’re paying for capability you can’t operationalize.

2. AthenaHQ. Best for Attribution and ROI Reporting

AthenaHQ leans hard into one thing: connecting AI visibility to revenue. Where most tools stop at “you got mentioned 47 times this week,” AthenaHQ tries to attribute downstream pipeline impact through integration with HubSpot, Salesforce, and Segment.

What works: The attribution layer is genuinely useful for marketing leaders who need to defend GEO budget upward. Prompt coverage is solid, around 30+ models and surfaces tracked. Reporting templates make CMO updates fast.

What doesn’t: Citation source data is thinner than Profound’s. You’ll see that you got cited, less where the model pulled from. The pricing also escalates fast, entry tier around $1,200/month, growth tier around $3,000/month.

Verdict: Best for revenue-accountable marketing teams that need to prove GEO impact in dollars, not visibility metrics.

3. Peec AI. Best for Lean Growth Teams

Peec AI is the tool we recommend most often to seed and Series A teams. It’s not the most powerful platform on this list, but it nails the 80/20 of what a small team actually uses.

geo-tools-depth-vs-accessibility-quadrant
The trade-off is real, enterprise tools dominate depth, smaller platforms win on speed-to-value.

What works: Clean interface. Fast setup, under an hour from signup to first useful dashboard. Tracks ChatGPT, Perplexity, Gemini, and Google AI Overviews with reasonable prompt depth. Pricing starts around $99/month, scales to $499/month for most growth-stage needs.

What doesn’t: Limited diagnostic depth. You’ll see your share of voice and competitor positioning, but root-cause analysis is shallow. Source attribution exists but isn’t as comprehensive as enterprise tools.

Verdict: If you’re under 50 employees and just want clear visibility data without a full-time analyst, Peec AI is hard to beat.

4. Semrush AI Optimization. Best for Existing Semrush Customers

If your team already runs on Semrush, the AI Optimization toolkit is the easiest add. It’s not the deepest GEO tool on this list, but the integration with Semrush’s existing keyword, backlink, and content data is genuinely valuable for SEO-led teams making the GEO transition.

What works: Cross-references AI visibility with traditional SERP data, useful for spotting where your SEO presence isn’t translating into AI citations. Pricing is bundled into existing Semrush plans, with the AI add-on around $200, 500/month additional.

What doesn’t: Citation source attribution is weaker than dedicated GEO platforms. Prompt coverage is narrower. The tool feels like an extension, not a primary platform.

Verdict: Strong choice if Semrush is already your home base. Probably not worth switching to Semrush just for this.

5. Ahrefs Brand Radar. Best for Brand Mention Tracking at Scale

Ahrefs took its brand mention tracking infrastructure and pointed it at AI surfaces. Brand Radar is more about presence detection than full GEO workflow, but it’s strong at what it does.

What works: Tracks brand mentions across web sources AI models actively crawl, with sentiment analysis and competitor benchmarking. Strong for teams that want both traditional brand monitoring and AI citation tracking in one tool. Pricing starts around $129/month with the Ahrefs base plan.

What doesn’t: Less prompt-driven than dedicated GEO tools. Doesn’t simulate buying-intent queries the way Profound or AthenaHQ do, it monitors mentions rather than testing AI responses.

Verdict: Best for teams that want brand monitoring and AI visibility in one platform, with SEO data alongside.

6. Writesonic GEO Platform. Best for Content-First Teams

Writesonic’s GEO Platform combines visibility tracking with content optimization recommendations. The angle: tell you not just where you’re invisible, but what content gaps to fill.

What works: Content recommendations are actually usable, not generic. The platform identifies the specific topics, formats, and structural elements AI models prefer when citing in your category. Pricing starts around $299/month for growth-stage features.

What doesn’t: Citation source attribution is limited. The platform optimizes for being cited but tells you less about the citation graph itself. Some recommendations skew generic if your category is niche.

Verdict: Strong fit for content marketing teams who want a tool that tells them what to write next, not just what’s broken.

7. Goodie AI. Best for Automated Optimization Workflows

Goodie AI is the most workflow-heavy tool on this list. It doesn’t just track, it pushes recommended changes into your CMS, monitors the impact, and iterates.

What works: The automation layer saves real time for teams that want GEO without building a full content ops process around it. Integration with WordPress, Webflow, and HubSpot is solid.

What doesn’t: Some of the automated recommendations are aggressive, we saw schema changes pushed that needed manual review. Pricing is mid-market, around $499, $1,500/month.

Verdict: Best for marketing teams without dedicated technical SEO support. Skip if you have a strong in-house SEO team that wants control over every change.

8. Rankscale AI. Best for Agencies Managing Multiple Brands

Rankscale AI was built for agencies. The multi-tenant architecture, white-label reporting, and per-client dashboards solve a real pain point for service businesses managing 10+ brands.

What works: Multi-brand management is genuinely leading. Reporting templates save hours per week per client. Pricing scales with seats and brands rather than locking you into enterprise tiers.

What doesn’t: Single-brand teams will pay for features they don’t need. Diagnostic depth is moderate, strong on tracking, lighter on root-cause.

Verdict: The clear winner for agencies and consultancies. Overkill for in-house teams.

9. Otterly AI. Best Free Starting Point

Otterly AI offers a free tier that gets you basic AI visibility tracking across major models. It’s not a long-term solution for serious teams, but it’s an honest entry point for understanding what GEO data looks like before committing budget.

geo-tools-pricing-team-fit-comparison-table
Match the tool to your stage, not the other way around.

What works: Free tier is actually useful, not crippled. Setup takes 15 minutes. Good for proving the concept internally before pitching budget.

What doesn’t: Limited prompt depth, no source attribution, basic competitor tracking. You’ll outgrow it within 3, 6 months if you’re serious.

Verdict: Use it as a 30-day diagnostic tool before evaluating paid platforms. Don’t build long-term workflows on it.

The Capability That Separates Real GEO Tools From Rebranded Rank Trackers

If you take one thing from this guide: citation source attribution is the dividing line.

A rank tracker tells you “you weren’t mentioned.” A real GEO tool tells you “ChatGPT pulled from these five sources to answer that query, and three of them mentioned your competitor.” That second answer is what makes the data actionable. Without it, you’re staring at a dashboard that shows you’ve lost without telling you why.

When evaluating any GEO platform, ask one question in the demo: “For this prompt where my brand isn’t cited, can you show me the exact URLs the model pulled from?” If the answer is no, or if the rep pivots to talking about prompt volume, you’re looking at a tracker, not an optimization platform.

The reason this matters operationally: AI visibility isn’t won by publishing more content. It’s won by getting cited on the publications, forums, and source documents that AI models actually pull from. You can’t fix what you can’t see.

How to Pick the Right GEO Tool for Your Team

Forget feature matrices. The decision comes down to three variables.

Team stage Budget reality What to prioritize Tool profile that fits
Pre-Series A Entry tiers from ~$99/month Basic visibility tracking across ChatGPT, Perplexity, Gemini, and AI Overviews to confirm whether you appear at all Lean observability platform that surfaces mentions and share of voice without enterprise overhead
Growth-stage Mid-tier, between entry and enterprise Prompt coverage (hundreds of unbranded buying queries run repeatedly) over headline model count, plus citation tracking Tool that pairs observability with diagnostic insight into why visibility is low
Enterprise $5,000+/month Share of voice vs. competitors, sentiment and context analysis, and a workflow layer that helps you fix gaps Platform doing both observability and workflow, not a rebranded rank tracker

Your Stage

  • Pre-Series A / under 50 employees: Peec AI, Otterly AI’s free tier, or Ahrefs Brand Radar if you already use Ahrefs. Don’t buy enterprise.
  • Series A, B / scaling marketing team: AthenaHQ for revenue attribution, Writesonic for content workflow, or Goodie AI for automated optimization.
  • Series C+ / dedicated AI visibility function: Profound for observability, AthenaHQ for attribution, or both.
  • Agency / multi-brand: Rankscale AI, full stop.

Your Existing Stack

If you’re already deep in Semrush or Ahrefs, the integration savings of staying in-platform usually outweigh the marginal capability gain of switching to a dedicated GEO tool. Don’t tear down what works.

Your Use Case Maturity

Three questions cut through the noise:

  1. Do we know what prompts buyers in our category actually run? (If no, start with a tool that has prompt discovery built in.)
  2. Can we operationalize the data once we have it? (If no, choose a tool with workflow automation, not raw observability.)
  3. Are we trying to prove ROI or improve performance? (If proving ROI, attribution matters more than depth. If improving performance, depth wins.)

The right answer changes based on what you’re actually trying to achieve. Most teams skip these questions and end up paying enterprise pricing for capability they never use.

The 14-Day Pilot Test Before You Sign Anything

Every tool on this list will give you a trial or pilot. Use it. Here’s the pilot framework that catches the gap between demo and reality:

Days 1, 3: Set up tracking with 30 unbranded prompts in your category. Run them across all available models. Note which prompts the tool surfaces vs. misses.

Days 4, 7: For three queries where you’re invisible, ask the tool to identify the source URLs the AI pulled from. If it can’t, that’s a deal-breaker for serious GEO work.

Days 8, 10: Export the data. Can your team actually use it in Notion, Sheets, or your existing reporting stack? Tools that lock data inside their UI are a long-term tax.

Days 11, 14: Run the same prompts again. How much variance is there? If results swing wildly without explanation, the tool’s sampling methodology isn’t rigorous enough to make decisions on.

This is the same pilot framework we run for clients evaluating GEO platforms. The number of tools that fail the source-attribution test on day 4 is higher than any vendor would admit.

marketing-team-evaluating-geo-platform-pilot
Two weeks of structured testing beats six months of vendor demos.

Tools sit one layer above strategy. Before picking a GEO platform, read the strategic framework behind generative engine optimization so you know which tool features actually matter for your team.

Related: generative engine optimization · tools for monitoring ChatGPT mentions · AI Overviews mentions tool

Frequently Asked Questions

What’s the difference between GEO tools and traditional SEO tools?

GEO tools track how AI systems describe and cite your brand in generated answers, while SEO tools track how your pages rank in traditional search results. The two are complementary, not interchangeable. SEO drives organic discovery; GEO drives AI recommendation. Most teams need both, but the workflows, data, and optimization tactics differ significantly.

Do I need a separate GEO tool if I already use Semrush or Ahrefs?

If your AI visibility needs are basic, tracking brand mentions and competitor positioning, the AI add-ons in Semrush and Ahrefs are usually enough. If you need deep citation source attribution, prompt simulation at scale, or revenue attribution, a dedicated GEO platform like Profound or AthenaHQ will outperform either tool’s AI module.

How much should I expect to spend on a GEO tool in 2026?

Entry-tier tools start around $99, $300/month for small teams. Mid-market platforms run $500, $1,500/month. Enterprise tools with full attribution, source tracking, and integration capability sit at $3,000, $5,000+/month. Most growth-stage B2B teams land in the $500, $1,500 range and get strong value there.

Which AI models do GEO tools typically cover?

Most major platforms track ChatGPT, Perplexity, Gemini, Claude, and Google AI Overviews. Some add Microsoft Copilot, You.com, and regional models. Coverage breadth matters less than coverage depth, a tool tracking five models with rigorous prompt sampling beats a tool tracking ten models with shallow sampling.

Can GEO tools tell me why my brand isn’t being cited?

The good ones can. Tools with strong citation source attribution will show you the URLs the AI model pulled from when answering a query, which usually reveals that competitors are mentioned on publications you’re absent from. Tools without this capability can only tell you that you weren’t cited, not why. That distinction matters more than any other feature.

How long before I see results from using a GEO tool?

The tool itself shows you data within hours. Actual visibility improvement takes longer, typically 3, 6 months of consistent work on the underlying citation sources, content structure, and entity authority. AI models update their training data and retrieval indexes on different cycles, so improvement isn’t linear. Teams that quit at month two miss the compounding effect.

Are GEO tools worth it for B2B companies under 50 employees?

Yes, but not at enterprise pricing. A tool like Peec AI at $99, $499/month gives small teams enough visibility data to make informed decisions about content and citation strategy. The mistake is jumping straight to Profound or AthenaHQ before you have the team to operationalize the data they produce.

Can I use GEO tools to track competitors?

Every tool on this list supports competitor tracking, that’s table stakes. The differentiator is depth: can the tool show you which competitors get cited on which sources, in which prompts, with what sentiment? Surface-level competitor tracking (“they got mentioned 47 times this week”) is far less useful than knowing which specific citation graphs your competitors dominate.

Pick the Tool That Matches Your Next Six Months

The biggest mistake teams make with generative engine optimization tools isn’t picking the wrong platform, it’s buying capability they’re not ready to use. A $4,000/month enterprise tool sitting unused is worse than a $99/month tool driving real decisions.

Start by answering one question honestly: what does your team realistically have the bandwidth to act on in the next quarter? If the answer is “we need to know if we’re invisible,” start with a basic tracker. If the answer is “we need to know why and fix it,” step up to a platform with source attribution. If the answer is “we need to prove this drives revenue,” buy for attribution capability above all else.

Run the 14-day pilot. Test the source attribution claim. Export the data. The tool that survives those three checks is the one that earns your annual contract.

Want a deeper look at the specific tactics that move AI citation rates? Read our practitioner guide on how to increase brand mentions in AI search results, it’s the playbook the tools on this list help you execute.

SEO & Social Monitoring Software: 2026 Buyer’s Guide

seo-and-social-monitoring-software-unified-dashboard

Seo & social monitoring software, Most marketing teams run two monitoring stacks that never talk to each other. SEO tools watch rankings, backlinks, and technical health. Social tools watch mentions, sentiment, and conversations. Neither sees the full picture, and the gap between them is where brand crises grow, competitor wins go unnoticed, and pipeline opportunities slip past.

SEO & social monitoring software combines search performance tracking (rankings, backlinks, site health, share of voice in search) with social listening (brand mentions, sentiment, competitor activity, conversation volume) into one workflow. The best 2026 stacks pull both data streams into a single alert system so your team responds to a Reddit thread, a ranking drop, or a sudden spike in branded search the same way: fast, with context.

This guide is for marketing leads who are tired of stitching dashboards together. We’ll cover what to evaluate, where most stacks fail, the tools worth your shortlist, and how to build a monitoring system that actually catches what matters.

What You’ll Learn

  • The real difference between SEO monitoring and social monitoring, and why treating them separately costs you
  • The 7 capabilities your stack must cover, scored against the 11 most-used tools
  • Honest pricing reality for 2026 (most “starting at” prices triple once you actually use the tool)
  • How to build a unified alert workflow without buying a $40k enterprise suite
  • The mistakes that turn monitoring into noise instead of signal
Seo & Social Monitoring Software, seo-and-social-monitoring-software-unified-dashboard
The point of unified monitoring isn’t more data, it’s fewer dashboards and faster decisions.

SEO Monitoring vs Social Monitoring: Why You Need Both

SEO monitoring tracks how your site performs in search: keyword rankings, backlinks gained or lost, technical errors, Core Web Vitals, indexing issues, and Google algorithm volatility. Social monitoring tracks how your brand is talked about: mentions on Twitter/X, Reddit, LinkedIn, news sites, blogs, podcasts, review platforms, and YouTube comments.

The teams that treat these as separate disciplines miss the most important signal of all: the connection between them.

A competitor launches a feature. Reddit lights up. Branded search for that competitor jumps 40% inside two weeks. Their pages start outranking yours for shared category terms. By the time your SEO tool flags the ranking drop, you’re three weeks behind the conversation that caused it.

Or the reverse: your team ships a great PR placement. The article ranks. Your brand mentions spike. Inbound traffic climbs. But because nothing connects the publication, the rankings, and the mentions in one view, no one inside the company can prove what worked, so the budget gets cut next quarter.

This is why unified monitoring matters now in a way it didn’t five years ago. Search and social are no longer separate funnels. They’re one continuous signal.

What Each Half Actually Tracks

SEO Monitoring Social Monitoring
Keyword rankings (daily/weekly) Brand and competitor mentions
Backlink gains and losses Sentiment trends
Site health, crawl errors, broken links Reach and share of voice
SERP feature changes (AI Overviews, snippets) Influencer and creator activity
Branded vs non-branded traffic Trending topics and conversations
Competitor ranking shifts Crisis signals and review spikes

Run only the left column and you’ll miss why your rankings move. Run only the right and you’ll miss whether the buzz translated to revenue.

The 7 Capabilities Your Stack Must Cover

Before you compare tools, get clear on what monitoring needs to do. Most teams overbuy on features they never use and underbuy on the basics that matter daily.

1. Real-Time Alerts (Not Daily Digests)

If a Reddit thread about your brand goes viral at 7am and your tool emails you a digest at 5pm, you’ve already lost the day. Look for push alerts via Slack, Teams, or SMS for high-priority signals: spikes in mentions, sentiment drops, ranking crashes, or sudden backlink loss. Daily digests work for everything else.

2. Source Coverage Breadth

Coverage claims are the single most inflated number in this category. “Monitors 150 million sources” usually means the tool indexes that many domains, not that it actually surfaces useful mentions from all of them. Check the platforms that matter for your category: Reddit (often weak), niche forums, podcasts, newsletters, Substack, Discord, and review sites like G2 or Capterra.

3. Sentiment Analysis That You Can Trust

Most tools claim 80, 85% sentiment accuracy. In practice, B2B sentiment analysis runs closer to 65, 75%, sarcasm, technical language, and industry slang trip up the models. Don’t make critical decisions on sentiment scores alone. Use them for trend direction, not as a single source of truth.

4. Competitor Tracking in Both Streams

The tool should let you monitor 3, 5 competitors with the same depth as your own brand. Their ranking shifts, their backlink wins, their mention spikes. This is where most stacks fall short, they track your brand well and treat competitors as an afterthought.

5. Historical Data and Backfill

The day you set up a tool, your historical record starts. If the tool offers 12 months of backfill, take it. Six months from now, when leadership asks “did our rebrand actually move the needle?”, you’ll need the before-and-after.

6. Reporting That Doesn’t Cost a Day

White-label PDF reports, scheduled email exports, and live shareable dashboards. If building a monthly client or executive report takes more than 30 minutes, the tool is failing you.

7. Integrations

Slack, Google Sheets, Looker Studio, HubSpot, Salesforce, and the major BI tools. The data has to go where your team already works, not into another dashboard nobody opens.

seo-social-monitoring-software-evaluation-scorecard
Score each tool 1, 5 against these seven before you sit through a demo. The vendors that lose on more than two are not your shortlist.

The 11 Tools Worth Comparing in 2026

Below is the working shortlist most B2B teams end up evaluating. The split is intentional, pure SEO tools, pure social tools, and the few that genuinely span both. We’ve used most of these in client work over the last three years; pricing and feature notes reflect what shows up on contracts, not what shows up on landing pages.

Tools That Cover Both SEO and Social Signals

Tool Best For Real Starting Price Watch Out For
Semrush Mid-market teams wanting one platform for SEO + brand mentions $140/mo (Pro tier) Social monitoring is bolted on, not native depth
Brand24 Strong social listening with basic SEO/mention overlap $149/mo (Plus tier) Real-time only on higher tiers
Mention SMBs and agencies needing both with a clean UI $49/mo (limited) Mention volume caps fill fast
Talkwalker (Hootsuite) Enterprise unified monitoring across channels $9,000+/year Enterprise-only pricing, long onboarding

SEO-First Tools

Tool Best For Real Starting Price Watch Out For
Ahrefs Backlink monitoring and competitor analysis depth $129/mo (Lite) Lite tier is genuinely limited; most teams need Standard ($249)
Moz Pro Beginner-friendly SEO monitoring with local SEO tools $99/mo (Standard) Index size smaller than Ahrefs/Semrush
AccuRanker Daily rank tracking precision for agencies $129/mo (Starter) Rank tracking only, not a full suite

Social-First Tools

Tool Best For Real Starting Price Watch Out For
Awario Boolean search depth for niche monitoring $49/mo (Starter) Reporting feels dated
Sprout Social Customer support teams handling inbound $249/user/mo Per-user pricing scales fast
Brandwatch Enterprise consumer brands needing deep listening Custom (typically $1,000+/mo) Heavy lift to set up well
BrandMentions B2B teams wanting mention tracking with web + social coverage $99/mo (Growing) Stronger on web mentions than native social analytics

Two notes worth flagging. First, every tool here has a free trial of 7 to 30 days, actually use them before committing. Demos hide friction. Second, the “starting price” column is what you see on the website. The real price most teams pay sits 1.5x to 3x higher because of seat limits, mention volume caps, and historical data add-ons. Build that into your budget conversation.

seo-social-monitoring-tools-comparison-quadrant
Talkwalker covers the most ground but at enterprise pricing. For mid-market teams, Semrush plus a focused social tool usually wins on cost and clarity.

How to Build a Unified Monitoring Workflow

The mistake most teams make is buying tools first and figuring out the workflow later. The result is two dashboards nobody opens, three Slack channels nobody reads, and quarterly reports built from scratch every time.

Build the workflow first. Then buy the tools that fit it.

Define Three Alert Tiers

Not every signal deserves the same response. Tier your alerts before you set them up:

  • Tier 1 (immediate response): Sentiment crash, ranking loss on top-5 commercial keywords, viral negative mention with 1k+ engagements, branded backlink loss from a top-tier domain. These hit Slack #monitoring-urgent and get a human within 30 minutes.
  • Tier 2 (same-day review): Mention spikes, new competitor backlink wins, ranking shifts on tracked secondary keywords, new review on G2 or Capterra. Daily digest, reviewed each morning.
  • Tier 3 (weekly review): Share of voice trends, sentiment direction over 7 days, content gap analysis, technical SEO drift. Weekly report, reviewed during marketing standup.

If everything is Tier 1, nothing is. The teams that get monitoring right are ruthless about what hits the urgent channel.

Assign Each Signal to a Person

An alert that nobody owns is noise. For each tier, name the responder. Tier 1 negative mentions go to your comms lead. Tier 1 ranking drops go to your SEO lead. Tier 2 competitor backlink wins go to your link building manager. Write it down. Put it in the runbook. Without ownership, alerts pile up and the team learns to ignore the channel.

Centralize the Reporting

Pull SEO and social data into one place. Looker Studio, Databox, or a clean Google Sheet works fine. The point isn’t a fancy dashboard. It’s that when leadership asks “how’s brand health?” you have a single answer instead of four tabs.

monitoring-alert-tiers-workflow-diagram
If everything is urgent, nothing is. Triage your alerts before you turn the tool on, not after.

One pattern we’ve seen across B2B clients: the teams that build a single one-page brand health dashboard (mention volume, sentiment, share of voice in search, branded search trend) get budget renewed faster than teams with twenty-tab reporting. Simple wins.

The Mistakes That Turn Monitoring Into Noise

Three patterns kill monitoring programs faster than anything else. We see them in nearly every audit of a client’s existing stack.

Tracking Too Many Keywords

Teams set up 200 keyword alerts because the tool allows it. Now every alert email has 200 entries and nobody reads it. Cap your tracked keywords at 30: ten branded, ten commercial high-intent, ten competitor terms. Add seasonally if a campaign needs it. Cut what doesn’t move.

Treating All Mentions as Equal

A mention on Forbes and a mention on a 12-follower Twitter account both register as one mention in most tools. They’re not the same thing. Filter your reporting by reach, domain authority, or follower count so leadership reviews signal, not volume. The 5 mentions per month on high-authority publications matter far more than the 500 on noise.

Buying the Big Suite Before You Need It

Talkwalker, Brandwatch, and Sprinklr are excellent, for enterprise teams with dedicated analysts. If your monitoring team is one marketing manager with 20% of their week to spend on this, a $40k/year suite will sit unused. Start with a $200/month combined stack (Semrush + Brand24, or Ahrefs + Mention). Scale up only when you’ve outgrown the workflow, not the brand.

How AI Search Changes Monitoring in 2026

One shift worth flagging because it’s now affecting how every tool on this list reports data. AI Overviews appear in roughly 15, 18% of US search results in late 2025, and that share is climbing. ChatGPT, Perplexity, and Gemini are increasingly the first answer surface for B2B research queries.

What this means for monitoring: branded search and rankings still matter, but so does whether AI assistants cite your brand. Most SEO tools added “AI Overview tracking” in 2026; the depth varies. Semrush, Ahrefs, and a handful of newer entrants now flag when your domain is cited in AI responses. If your category sees heavy AI search adoption, factor this into your tool selection, it’s an emerging signal, not a mature one yet.

For a deeper look at tracking AI citations specifically, see our guide on how to track brand mentions in AI search results.

Pricing Reality: What You’ll Actually Pay

The published “starting at” price is rarely the price you’ll pay after a year. Here’s what real costs look like for different team sizes, based on contracts we’ve seen:

Team Size Recommended Stack Annual Cost (USA)
Solo founder / SMB Mention + Google Search Console (free) $600, $1,200
5, 10 person marketing team Semrush + Brand24 $3,500, $5,500
Mid-market B2B (20, 50 marketers) Ahrefs + Brand24 or Mention + custom dashboards $8,000, $15,000
Enterprise Talkwalker or Brandwatch + Ahrefs Enterprise $30,000, $80,000

Two budget rules worth holding to: don’t spend more than 4, 6% of your marketing budget on monitoring tools, and don’t sign multi-year contracts on tools you’ve used for less than 90 days. Vendor lock-in costs more than you’ll save on the discount.

For most B2B teams in 2026, a unified monitoring stack costs between $3,500 and $15,000 per year and combines an SEO platform like Semrush or Ahrefs with a social listening tool like Brand24 or Mention. Enterprise suites like Talkwalker and Brandwatch start at $30,000 and up.

Frequently Asked Questions

What’s the difference between SEO monitoring software and social monitoring software?

SEO monitoring tracks how your website performs in search, rankings, backlinks, technical health, and SERP feature presence. Social monitoring tracks how your brand is talked about online, mentions, sentiment, reach, and conversations across social media, news, blogs, and forums. The strongest 2026 stacks combine both into one alert workflow because search and social signals increasingly drive each other.

Can one tool do both SEO and social monitoring well?

A handful try, but most do one well and the other adequately. Semrush has solid SEO with bolted-on social monitoring. Talkwalker covers both at enterprise scale. For most mid-market teams, two specialized tools, one SEO-first, one social-first, outperform a single all-in-one platform on depth and cost.

How much should a small business spend on monitoring software?

For a solo founder or SMB, $50, $100 per month covers the basics: a tool like Mention plus free options like Google Search Console and Google Alerts. Spend more only when you have a person dedicated to acting on the data. Tools without operators are sunk costs.

Are free SEO and social monitoring tools enough?

For very early-stage brands, yes. Google Search Console handles SEO basics. Google Alerts catches major web mentions. Both are free and useful. The limits show up around 50, 100 brand mentions per month, at that volume, free tools miss too much, alerts arrive late, and reporting falls apart. Upgrade when you’re consistently outgrowing what free tools surface.

How accurate is sentiment analysis in monitoring tools?

Vendors claim 80, 85% accuracy. Real-world B2B accuracy runs closer to 65, 75% because sarcasm, technical jargon, and industry slang trip up the models. Use sentiment scores for trend direction (is it rising, falling, stable?) rather than as a final verdict on individual mentions.

How often should I review monitoring data?

Tier 1 alerts (negative spikes, ranking crashes) need response within 30 minutes. Tier 2 alerts (mention growth, new backlinks) review daily. Tier 3 trends (share of voice, sentiment direction) review weekly. Monthly is for executive reporting, not for catching issues, by month-end, the issue has either resolved itself or done damage.

Do I still need monitoring software if I use Google Search Console and Google Alerts?

For brands under 200 web mentions per month and under 50 tracked keywords, the free combination handles most of what you need. Beyond that, paid tools earn their cost through faster alerts, deeper coverage, sentiment analysis, competitor tracking, and reporting that doesn’t take half a day to build manually.

How does AI search affect SEO and social monitoring in 2026?

AI Overviews appear in roughly 15, 18% of US search results, and AI assistants like ChatGPT and Perplexity are now common research surfaces. Most SEO tools added AI Overview tracking in 2026, but depth varies. If your buyers research through AI assistants, factor AI citation tracking into your monitoring stack alongside traditional rankings and mentions.

Build the Stack You’ll Actually Use

The best monitoring stack isn’t the one with the most features, it’s the one your team opens every morning, the one that surfaces the right signal at the right tier, the one that turns into action instead of another report nobody reads. Most teams overbuy on capability and underinvest in workflow. Flip that. Define your three alert tiers, name the owners, and pick the smallest stack that covers what you need.

Want to see how unified monitoring fits with broader brand intelligence? Read our deeper guide on the best social media monitoring tools or how to choose an SEO competitor analysis tool.

How to Track Which AI Bots Crawl Your Site (2026)

ai-bot-tracking-data-layers-diagram

How to track which ai bots crawl your site, If GPTBot, ClaudeBot, and PerplexityBot aren’t reaching your site, you won’t show up in AI answers. It’s that simple. The first job before any AI visibility work is confirming which bots are actually hitting your pages, how often, and what they’re pulling. Most teams skip this step and wonder why their content never gets cited.

Tracking AI bots isn’t a new discipline. It’s log file analysis with an updated user-agent list. You track AI bots by filtering server logs or CDN analytics for known AI crawler user-agent strings, then verifying authenticity through reverse DNS or published IP ranges. The tools you already have. Cloudflare, Akamai, Vercel, raw access logs, already capture this data. You just need to know what to look for.

This guide walks through the exact methods, the user-agents that matter in 2026, and how to turn bot data into something useful.

What You’ll Learn

  • The 12 AI bot user-agents worth tracking right now (and which ones to ignore)
  • Three methods to detect AI crawlers, server logs, CDN dashboards, and bot tracking tools
  • How to verify a bot is real and not a spoofed user-agent
  • What healthy AI bot traffic looks like, and what crawl gaps signal
  • How to set alerts for sudden bot drops, spikes, or new crawlers
How To Track Which Ai Bots Crawl Your Site, ai-bot-tracking-data-layers-diagram
Bot tracking gets clearer as you move up the stack, but the raw logs are still where the truth lives.

Which AI Bots Actually Matter in 2026

The AI crawler ecosystem has split into three categories. Treating them the same is the most common tracking mistake.

training-bots-vs-retrieval-bots-traffic-pattern
Training bots come in waves. Retrieval bots are a steady drumbeat, and they’re the ones that signal real AI visibility.

Training crawlers pull content into model training datasets. They visit infrequently but at scale.

Retrieval crawlers fetch pages in real time when a user asks an AI assistant a question. These are the ones tied directly to citation events.

Hybrid agents do both, depending on context.

Here’s the user-agent list worth filtering for:

Bot Operator Type User-Agent String
GPTBot OpenAI Training GPTBot
OAI-SearchBot OpenAI Retrieval OAI-SearchBot
ChatGPT-User OpenAI User-triggered fetch ChatGPT-User
ClaudeBot Anthropic Training ClaudeBot
Claude-Web Anthropic Retrieval Claude-Web
PerplexityBot Perplexity Hybrid PerplexityBot
Perplexity-User Perplexity User-triggered Perplexity-User
Google-Extended Google Training (Gemini) Google-Extended
Googlebot Google Search + AI Overviews Googlebot
Meta-ExternalAgent Meta Training Meta-ExternalAgent
Bytespider ByteDance Training Bytespider
Applebot-Extended Apple Training Applebot-Extended

Don’t waste time tracking every minor crawler. Start with GPTBot, OAI-SearchBot, ClaudeBot, PerplexityBot, and Google-Extended. Those five cover the platforms most B2B buyers actually use.

The most important AI bots to track in 2026 are GPTBot and OAI-SearchBot from OpenAI, ClaudeBot from Anthropic, PerplexityBot, and Google-Extended for Gemini. These five user-agents represent the AI platforms responsible for the majority of brand citations in AI search.

Method 1: Server Log Analysis (The Source of Truth)

Your server access logs capture every request, including bots. This is the most reliable tracking method because it doesn’t depend on third-party detection or JavaScript firing.

Logs typically live at /var/log/nginx/access.log, /var/log/apache2/access.log, or in your hosting provider’s log dashboard. Each line contains the IP address, timestamp, requested URL, status code, and user-agent string.

Pulling AI Bot Hits from Raw Logs

For Nginx or Apache, a basic grep gets you started:

grep -E "GPTBot|ClaudeBot|PerplexityBot|OAI-SearchBot|Google-Extended" access.log

That returns every line where one of those user-agents requested a page. Pipe it into awk or cut to extract URLs, count requests per bot, or find the most-crawled pages. For larger sites, GoAccess turns raw logs into a real-time dashboard with bot filtering built in.

What to Pull Weekly

  • Total requests per AI bot
  • Top 20 pages each bot visited
  • Status codes returned (4xx and 5xx errors mean bots are getting blocked)
  • Crawl frequency per bot (daily, weekly, monthly cadence)
  • Pages that received zero AI bot traffic in the last 30 days

That last one is the gold. Pages AI bots aren’t reaching can’t be cited. If your highest-converting page hasn’t been crawled by GPTBot in 6 weeks, that’s a fixable problem.

The Limitation

Raw log analysis is powerful but slow. Logs rotate, queries take time, and you won’t catch issues in real time. For sites under 100k pages a month, manual log review every 1, 2 weeks works. Above that, you need automation.

server-access-log-ai-bot-grep-terminal
What you’re hunting for: the user-agent string at the end of each request. Three lines here, three different AI crawlers.

Method 2: CDN and Edge Provider Dashboards

If you run Cloudflare, Akamai, Fastly, or Vercel in front of your site, you already have AI bot tracking, most teams just don’t know where to look.

Cloudflare

Cloudflare’s Bot Analytics dashboard categorizes traffic into “verified bots,” “likely bots,” and “humans.” Inside the verified bots view, you can filter by specific AI crawlers including GPTBot, ClaudeBot, PerplexityBot, and Google-Extended. The free tier shows the last 24 hours; paid plans extend this to 30+ days. Cloudflare also publishes its AI Crawler Index, which tracks which bots crawl the web most actively across millions of sites.

Akamai

Akamai’s Bot Manager gives granular control and visibility, including custom rules per AI bot. You can route GPTBot traffic to a different cache, log it separately, or apply rate limits without blocking. The reporting dashboard shows hits per bot over configurable timeframes.

Vercel

Vercel’s edge logs capture user-agent data for every request. The Observability tab in newer versions of the Vercel dashboard surfaces bot traffic without requiring you to leave the platform. Filter by user-agent in the request logs view.

Fastly

Fastly’s real-time log streaming sends access data to your destination of choice. BigQuery, Datadog, S3, where you can build custom AI bot dashboards with whatever query tooling your team already uses.

The CDN approach beats raw logs for one reason: speed. You can see a GPTBot crawl spike within minutes, not days.

Method 3: Dedicated AI Bot Tracking Tools

Several tools have launched specifically to track AI crawler traffic. They sit on your server, in your CDN, or as a JavaScript tag, and produce dashboards focused on AI bot activity.

ai-bot-tracking-dashboard-mockup
A purpose-built dashboard surfaces the data faster, but the underlying answer is always the same: which bots, which pages, how often.

The category includes Scrunch (Agent Traffic), Hall (Agent Analytics), Profound, Botify (log file analysis with AI focus), and newer entrants like LLMS Central and BotWatcher. They differ in how they collect data, some pull from logs, some from CDN integrations, some from a JS tag, but they all attempt to answer the same questions: which bots, which pages, how often.

These tools are useful when:

  • You don’t have engineering resources to query logs
  • You need historical data going back months
  • You want alerts on bot anomalies without building them yourself
  • You need to correlate bot crawls with citation events in AI answers

They’re less useful when you already have Cloudflare or Akamai dashboards with bot analytics and someone on the team comfortable in BigQuery. A purpose-built tool adds polish, not raw capability.

How to Verify a Bot Is Actually Real

User-agent strings can be spoofed by anyone. A scraper claiming to be GPTBot might be a competitor mining your content. Verification matters.

Two methods work in 2026:

Reverse DNS Lookup

Real OpenAI bots resolve to subdomains under openai.com. Real Anthropic bots resolve under anthropic.com. Real Perplexity bots resolve under perplexity.ai. Run a reverse DNS lookup on the IP address making the request:

host 20.171.207.1

If the result doesn’t end in the operator’s domain, the user-agent is fake. Drop the request from your analysis.

Published IP Ranges

OpenAI, Anthropic, and Perplexity all publish official IP ranges for their crawlers. OpenAI’s are documented at OpenAI’s bot documentation. Cross-reference each request’s IP against the published list. Cloudflare and Akamai do this automatically in their “verified bots” categorization.

Skip verification at your peril. We’ve seen sites where 30% of supposed GPTBot traffic was actually competitive scraping under a spoofed user-agent. That data, uncorrected, leads to wrong conclusions about AI visibility.

What Healthy AI Bot Traffic Looks Like

There’s no universal benchmark, bot traffic varies wildly by site size, content type, and category. But here are patterns we see consistently across B2B sites:

  • GPTBot typically crawls 5-15% of indexable pages per month on a healthy site
  • ClaudeBot tends to crawl less frequently but goes deeper on the pages it reaches
  • PerplexityBot shows the most volatile pattern, heavy crawl bursts tied to user query trends
  • Google-Extended follows Googlebot patterns closely; if Googlebot is crawling well, Google-Extended usually is too
  • OAI-SearchBot and ChatGPT-User hit specific pages tied to live user prompts, these are the bots most directly correlated with citation events

If you see zero traffic from any of these bots over 30 days, something’s wrong. Common causes: robots.txt blocks, WAF rules, JavaScript-only rendering that bots can’t parse, or accidental server errors returning 5xx codes to specific user-agents.

Setting Alerts for Bot Anomalies

Manual review catches issues eventually. Alerts catch them immediately. Three alerts every team should set:

1. Bot Drop Alert

Notify when any tracked AI bot’s daily request count falls below 25% of its 30-day average. This catches accidental robots.txt edits, WAF misconfigurations, and CDN rule changes that block bots silently.

2. Bot Spike Alert

Notify when any bot’s request count exceeds 300% of average. Spikes can indicate aggressive scraping under a spoofed user-agent or a real bot hammering your origin (rare but real, especially during model retraining cycles).

3. New Crawler Alert

Notify when a previously unseen AI-related user-agent string starts hitting your site. New bots launch every few months in 2026, you want to know which ones to add to your tracking before they accumulate three months of unmeasured traffic.

Cloudflare, Datadog, and most log management platforms support these alerts natively. Wire them into Slack or email, bot anomalies are urgent enough to interrupt the day.

Common Mistakes Teams Make Tracking AI Bots

Five patterns to avoid:

Tracking only training bots. Training crawlers like GPTBot and ClaudeBot matter for long-term presence in model knowledge. But retrieval bots. OAI-SearchBot, Perplexity-User, ChatGPT-User, are the ones tied to actual citation events happening today. Track both.

ai-bot-crawl-to-citation-funnel
Bots reaching your pages is the floor, not the ceiling. The pages that get cited are a smaller, more selective set.

Confusing bot traffic with AI referral traffic. Bot traffic is AI crawlers fetching your pages. AI referral traffic is humans clicking from ChatGPT or Perplexity to your site. They’re different metrics measured in different places. Don’t mix them in the same dashboard.

Ignoring 4xx and 5xx responses. A bot getting 200 responses across 1,000 pages is healthy. A bot getting 403s across 1,000 pages is a problem. Always pair bot hit counts with status code distribution.

Blocking bots accidentally. WAF rules tuned to stop scrapers often block legitimate AI crawlers as collateral. If you see a bot’s traffic suddenly drop, check your WAF logs before assuming the bot deactivated.

Treating bot data as the goal. High bot traffic doesn’t mean high AI citation rates. It means bots can reach your pages, necessary but not sufficient. The next step is making sure your content earns citations once bots arrive. That’s a separate problem.

Turning Bot Data Into Action

Tracking is the diagnostic. Here’s what the data tells you to do:

Pages with high bot traffic but no AI citations are usually retrieval-ready but not citation-worthy. Improve specificity, add data, strengthen the entity definitions, and rewrite for extractability.

Pages with low bot traffic are accessibility problems. Check robots.txt, WAF rules, JavaScript rendering, internal linking, and sitemap inclusion. Bots can’t cite what they can’t reach.

Pages with declining bot traffic over time are usually the canary for a technical regression, a recent deploy broke something. Cross-reference the date of the drop with your deploy log.

New bots appearing in your logs mean new platforms entering the AI search ecosystem. Decide quickly whether to allow them (most cases) or block them (specific competitive concerns). Don’t leave the question unanswered for months.

Bot tracking is the first 20% of AI visibility work. The remaining 80% is content strategy, entity authority, and earning placements on the publications AI models reference. But none of that compounds if bots can’t reach your site to begin with.

Related: how to write llms.txt · how AI crawlers pick sources · what is llms.txt

Frequently Asked Questions

How do I check if AI bots are crawling my site right now?

Open your server access logs and search for user-agents like GPTBot, ClaudeBot, PerplexityBot, OAI-SearchBot, and Google-Extended. If you use Cloudflare, the Bot Analytics dashboard shows verified AI bot traffic without log access. The fastest check is running grep -E "GPTBot|ClaudeBot|PerplexityBot" access.log on your most recent log file.

Do AI bots respect robots.txt?

Most major AI bots. GPTBot, ClaudeBot, PerplexityBot, Google-Extended, publicly commit to respecting robots.txt directives. User-triggered fetches like ChatGPT-User and Perplexity-User often bypass robots.txt because they’re treated as user-initiated requests rather than automated crawls. Smaller or unofficial AI scrapers may ignore robots.txt entirely. Verification through reverse DNS or IP ranges is the only reliable check.

Can I track AI bots in Google Analytics?

No, not reliably. Google Analytics is JavaScript-based, and most AI bots don’t execute JavaScript or get filtered out by GA’s bot exclusion rules. Server logs, CDN dashboards, and dedicated bot tracking tools are the only methods that consistently capture AI crawler traffic.

What’s the difference between GPTBot and OAI-SearchBot?

GPTBot crawls pages to gather data for OpenAI’s model training, it builds long-term knowledge in ChatGPT. OAI-SearchBot fetches pages in real time when ChatGPT needs current information to answer a user’s question. GPTBot impacts what ChatGPT knows about your brand over months; OAI-SearchBot impacts whether your page gets cited in a specific answer today.

How often should I review AI bot traffic?

Weekly review is enough for most B2B sites. Set automated alerts for bot drops, spikes, and new crawlers so you don’t miss anomalies between reviews. Sites publishing high volumes of new content should review more frequently to confirm new pages are being crawled within reasonable timeframes.

Should I block any AI bots?

For most B2B brands, no. Blocking AI bots removes your content from AI training data and AI search results, exactly the opposite of what you want for visibility. The exceptions: paywalled content, proprietary research you don’t want repurposed, and sites where AI scraping causes server load issues. Make this decision deliberately, not by default.

What’s a normal AI bot traffic volume?

Volume varies enormously by site size and content type. A more useful benchmark is consistency, major AI bots should appear in your logs every week, hitting a meaningful percentage of your indexable pages each month. If you see zero AI bot traffic over 30 days, treat that as a problem regardless of site size.

How do I know if my robots.txt is blocking AI bots?

Check your robots.txt file at yourdomain.com/robots.txt and look for Disallow rules targeting GPTBot, ClaudeBot, PerplexityBot, or Google-Extended. Free tools like the AI Crawler Access Checker show exactly which AI bots are allowed or blocked by your current robots.txt configuration. Run this check after every robots.txt edit.

Get the Crawl Data, Then the Citation Strategy

Tracking which AI bots crawl your site is a 1-hour setup task with a multi-month payoff. Pull your access logs this afternoon, filter for the five bots that matter, and check what’s happening. If the answer is “not much,” you’ve found a problem worth fixing. If the answer is “plenty,” you’re ready for the harder work, turning crawl access into actual citations in AI answers.

Want a deeper view of what AI is saying about your brand once those bots are crawling? Our guide on tracking brand mentions in AI search covers what to do with the visibility you’re earning.

AI Visibility for Healthtech Companies: 2026 Playbook

ai-visibility-gap-healthtech-search-vs-chatgpt

Ai visibility for healthtech companies, Your hospital system buyer just asked ChatGPT which remote patient monitoring vendors fit a 200-bed community hospital. Three names came back. Yours wasn’t one of them. Your competitor, smaller, less funded, worse product, was named first. That’s the AI visibility gap, and for healthtech companies it’s already shaping pipeline decisions before a single sales call happens. This playbook covers what works in 2026: how to earn citations from the publications AI models trust, how to stay inside HIPAA and FDA boundaries while doing it, and how to measure whether any of it is moving your numbers.

What You’ll Learn

  • Why healthtech buyers, hospital systems, payers, investors, now use AI assistants before vendor calls
  • The three publication tiers AI models actually pull from for healthcare recommendations
  • How to build a compliance-safe claim matrix that protects you across FDA, HIPAA, and state regulators
  • A 90-day execution plan with specific milestones for citation density and AI mention rate
  • The metrics that connect AI visibility to qualified pipeline (and the ones that don’t)
Ai Visibility For Healthtech Companies, ai-visibility-gap-healthtech-search-vs-chatgpt
Ranking on Google and being recommended by ChatGPT are now two separate games, and healthtech buyers are increasingly playing the second one first.

Why Healthtech Buyers Reach for AI Before They Reach for You

Hospital procurement teams aren’t searching Google the way they did in 2023. A VP of clinical operations evaluating remote monitoring vendors will ask Perplexity for a shortlist, cross-check Claude on integration risk with Epic, then send the names that survive both passes to their CIO. By the time a vendor lands a discovery call, the AI has already shaped the consideration set.

This shift hits healthtech harder than other categories for three reasons. Sales cycles are long, so any influence at the awareness stage compounds across months of consideration. Buyers are risk-averse, so anything that flags credibility, or absence of it, gets disproportionate weight. And category language is technical, which means AI models have to work harder to disambiguate vendors, which makes citation signals decisive.

Healthtech companies that show up early in AI responses get a structural advantage that’s hard to claw back later. The ones that don’t appear at all aren’t being rejected, they’re being filtered out before the buyer ever sees them.

What Changed Between 2024 and 2026

Two years ago, getting cited by ChatGPT was a curiosity metric. Today it’s a leading indicator of pipeline. AI assistants now handle a meaningful share of vendor research in B2B healthcare, and AI Overviews sit at the top of clinical and operational queries on Google. The buyers most likely to use AI tools first, younger clinical leaders, digital-native procurement teams, growth-stage health system VPs, are also the ones writing the next wave of vendor contracts.

If your visibility strategy is still organized around keyword rankings and gated whitepapers, you’re optimizing for a layer of the funnel that fewer buyers touch each quarter.

How AI Models Actually Decide Which Healthtech Brands to Name

AI assistants don’t pick vendors randomly. They lean on patterns from training data and real-time retrieval, and in healthcare those patterns favor entities with three traits: clear category positioning across multiple credible sources, consistent naming across the web, and absence of trust-damaging signals like FDA warning letters or unresolved data breach coverage.

ai-citation-pillars-healthtech-brands
AI models cite brands that score well on all four pillars at once, citation thinness on any single one drops you out of recommendations.

The mechanic matters because it tells you what to fix. A healthtech company invisible in AI responses usually has one of these problems:

  • Citation thinness, the brand appears in its own marketing content but rarely in third-party editorial coverage
  • Entity fragmentation, multiple product names, an acquisition that changed the parent company, or a domain migration that scrambled the brand graph
  • Category ambiguity, the company describes itself in language no buyer or analyst uses, so AI can’t confidently slot it into a recommendation
  • Trust gaps, old negative coverage that AI still surfaces, or a complete absence of credibility signals like clinical study citations and SOC 2 verification

Fix the inputs and citations follow. The healthtech brands ChatGPT names confidently in 2026 are almost always brands that built consistent third-party presence months earlier.

The Three Publication Tiers That Drive Healthtech Citations

Not every publication is equal in AI training data, and in healthcare the weighting is sharper than in other verticals. Generic high-DA business sites help, but they don’t carry the same signal as a specialty trade publication or a peer-reviewed clinical outlet. Your earned media plan should hit three lanes deliberately.

Tier 1: Healthcare-Native Trade Publications

This is the highest-use tier for healthtech specifically. Outlets like Fierce Healthcare, MedCity News, Healthcare IT News, STAT News, Modern Healthcare, and Becker’s Hospital Review carry disproportionate weight because AI models have learned to associate them with credible healthcare commentary. A single thoughtful contributed piece in MedCity News on RPM reimbursement trends will move citation density faster than five business-press features.

Pitch angles that work: category analysis, regulatory commentary, integration architecture explainers, market sizing pieces grounded in real data. Pitch angles that don’t: product announcements, funding press releases without strategic context, generic “AI in healthcare” thought leadership.

Tier 2: Digital Health and Healthtech-Adjacent Outlets

Rock Health, Second Opinion, Bessemer’s State of Healthtech, and category-specific newsletters cover the operational and investment side of healthtech. These outlets reach the buyers and capital allocators most likely to be using AI tools for early diligence. Coverage here builds the layer of context AI models need to confidently slot you into a recommendation.

Tier 3: General Business and Tech Press

Forbes, Fast Company, TechCrunch, Bloomberg, and the Wall Street Journal still matter, but for healthtech they’re amplifiers, not primary signals. A Forbes feature without supporting coverage in healthcare-native outlets reads as PR-driven and gets weighted accordingly. Treat Tier 3 as a layer that compounds the work done in Tiers 1 and 2.

Tier Example Outlets Citation Weight Best For
Tier 1: Healthcare Trade Fierce Healthcare, MedCity News, STAT, Becker’s Highest Category authority, regulatory framing
Tier 2: Digital Health Rock Health, Second Opinion, Bessemer reports High Buyer and investor visibility
Tier 3: General Business Forbes, TechCrunch, Bloomberg, WSJ Medium (as amplifier) Cross-domain credibility

The companies winning AI visibility in healthtech aren’t just chasing logos. They’re building presence across all three lanes on a quarterly rhythm so AI models keep encountering them in different contexts.

Building a Compliance-Safe Claim Matrix

Here’s the problem most healthtech communications teams hit: the messaging that wins citations is the same messaging that gets you a regulatory letter. Aggressive clinical claims, outcome guarantees, or anything that drifts toward “this device cures X” creates exposure under FDA promotional rules, HIPAA, and state attorneys general. Compliance-safe doesn’t mean boring, it means defensible.

Build a claim matrix before you pitch a single publication. The matrix is a single source of truth that legal, clinical, marketing, and external PR all work from. Every external statement maps to a row.

What Goes in the Matrix

  1. Approved claim, the exact language signed off by legal and clinical
  2. Evidence, the study, dataset, or operational metric backing the claim
  3. Boundary, what the claim explicitly does not say (e.g., “improves workflow efficiency” not “improves clinical outcomes”)
  4. Use cases, which channels and audiences the claim is approved for
  5. Owner, who can approve variants

Frame messaging around workflow, infrastructure, market dynamics, and integration architecture. These categories carry editorial value, get picked up by Tier 1 healthcare trade outlets, and stay clear of FDA promotional boundaries. Save clinical outcome claims for peer-reviewed publication and regulatory submissions where the proof bar is met properly.

The Sub-Vertical Problem

Compliance reality varies sharply across healthtech sub-verticals. A claim matrix for a clinical decision support vendor selling into hospital systems looks nothing like one for a wellness platform selling direct to consumers. Map your matrix to your actual regulatory profile:

  • SaMD and medical devices. FDA promotional rules, predetermined change control plans for AI/ML
  • Provider-facing SaaS. HIPAA, BAAs, security disclosure boundaries
  • Payer technology, state insurance regulator language, anti-discrimination compliance
  • Direct-to-consumer wellness. FTC substantiation rules, state consumer protection
  • Clinical research and pharma adjacent, promotional review, off-label discussion boundaries
compliance-safe-claim-matrix-healthtech-template
A working claim matrix saves you from rewriting every pitch from scratch, and from explaining yourself to a regulator later.

The 90-Day Healthtech AI Visibility Plan

Citations compound. That’s the good news and the hard news. You can’t shortcut the timeline, but you can make every week count by sequencing the work correctly. Here’s the plan that’s worked for healthtech companies moving from invisible to consistently cited.

Days 1, 30: Foundation

The first month is unglamorous and decisive. Skip it and the next 60 days don’t compound.

  • Audit current AI visibility, run 30 buyer-shaped prompts across ChatGPT, Perplexity, Gemini, and Claude. Document where you appear, where competitors appear, and which sources are being cited
  • Resolve entity fragmentation, one canonical company name, consistent product naming, clean Wikidata and Crunchbase entries, redirected legacy domains
  • Build the claim matrix, get legal and clinical signed off before any external pitch goes out
  • Map your tier-by-tier publication target list, 8 Tier 1 outlets, 5 Tier 2, 3 Tier 3 for the quarter
  • Identify three subject-matter experts internally who can be credibly bylined

Days 31, 60: Activation

Month two is when external work goes live. Pace matters more than volume.

  • Publish or place 4, 6 pieces across the three tiers, weighted toward Tier 1
  • Pitch contributed commentary on a regulatory or category development happening in your space
  • Submit to 2, 3 industry awards or rankings that AI models actively reference (KLAS, HIMSS, Rock Health lists)
  • Update your owned content layer, make sure your category positioning and proof points are crawlable, structured, and consistent with what you’re saying externally
  • Re-run the prompt audit at day 45, most teams see the first detectable shifts in citation patterns by week 6

Days 61, 90: Compound

Month three separates the teams who get results from the teams who quit at month two. Citations rarely move dramatically in 30 days. They move meaningfully across 90.

  • Sustain Tier 1 placement cadence, at least 2 strong pieces per month
  • Layer in research-driven content, a small original dataset, even 50 surveyed buyers, creates citation-worthy material
  • Land a podcast or video appearance on a healthcare-native show
  • Run the full prompt audit again, measure mention rate change, sentiment shift, and citation source overlap with competitors
  • Build the next 90-day plan based on what’s converting and what isn’t
90-day-healthtech-ai-visibility-plan-timeline
The teams that hit month four are the ones seeing consistent AI citations, most of the early work pays off after the 60-day mark.

How to Measure Whether Any of This Is Working

The measurement problem in AI visibility is real. You can’t pull a clean attribution report from ChatGPT, and Perplexity’s citation logs don’t tie to your CRM. But that doesn’t mean the work is unmeasurable. It means you measure leading indicators rigorously and connect them to lagging pipeline metrics over a longer window.

Leading Indicators (Track Weekly)

  • Mention rate, across a fixed prompt set of 30+ buyer-shaped queries, how often does your brand appear?
  • Citation source overlap, which publications are AI models pulling from when answering category queries, and how many of those sources mention you?
  • Position, when named, are you first, second, or last in the list?
  • Sentiment, is the AI describing you accurately, or repeating outdated framing?
  • Competitor delta, are you closing or widening the gap with the brands AI cites most often?

Lagging Indicators (Track Monthly)

  • Branded search volume, buyers who first encountered you through AI often come back via direct branded search
  • Inbound qualified pipeline tagged “AI-influenced”, add a single question to demo request forms: “Where did you first hear about us?”
  • Sales call mentions, track how often prospects say “ChatGPT” or “Perplexity” unprompted in discovery calls
  • Citation density on your owned brand graph, how many high-quality third-party mentions exist of your brand, versus three months ago?

The honest version: AI visibility is a brand investment with a delayed conversion signature. The teams that report cleanly on it are the ones that decided in advance which leading indicators they trust, then watched lagging indicators move in the same direction over a quarter or two. If you wait for a perfect attribution model before investing, your competitors will lock in citation positions you’ll spend a year trying to dislodge.

The Mistakes Healthtech Teams Keep Making

A few patterns show up often enough that they’re worth flagging directly.

Treating AI visibility as a content marketing problem. It isn’t. Content marketing builds owned-media depth. AI visibility is mostly an earned-media and entity-clarity problem. Publishing more on your own blog won’t change what ChatGPT says about you.

Pitching the same product story to every tier. The pitch that lands in Forbes won’t land in MedCity News. Tier 1 healthcare outlets want category insight, not founder profiles. Customize per tier or skip the pitch.

Quitting at week 8. The single most common failure mode. Citation patterns shift on a 60, 90 day lag. Teams that pull the plug at the end of month two never see the curve they were paying for.

Ignoring entity hygiene. If your acquisition history, product naming, or domain structure confuses AI models, all the earned media in the world won’t help. Fix the entity layer first.

Letting compliance become an excuse. “We can’t say anything externally” is rarely true once a real claim matrix exists. The teams that say it usually haven’t built one.

Frequently Asked Questions

How long does it take to see AI visibility results for a healthtech company?

Detectable shifts in mention rate typically show up between weeks 6 and 10. Meaningful, sustained citation presence usually takes 90 to 180 days, depending on how thin your starting baseline was. Healthtech moves slightly slower than other B2B verticals because AI models weight healthcare-trade publications heavily, and those outlets have longer editorial cycles.

Can healthtech companies do AI visibility work without compliance risk?

Yes, with a working claim matrix in place. The risk isn’t AI visibility itself, it’s making promotional claims that drift outside legal, clinical, or regulatory boundaries. Frame messaging around workflow, infrastructure, market dynamics, and category insight rather than clinical outcomes, and the work stays defensible.

Which AI assistants matter most for healthtech buyers?

ChatGPT and Perplexity dominate early-stage vendor research in B2B healthcare. Gemini matters for queries that surface in Google AI Overviews. Claude is gaining ground with technical and clinical leaders evaluating integration risk. Track all four, the signals diverge enough that any single platform misses real movement.

What’s the difference between AI visibility and SEO for healthtech?

SEO optimizes pages to rank in search results. AI visibility optimizes the entity and citation graph so AI models confidently name your brand in generated answers. The work overlaps, both reward credible third-party coverage, but the tactics diverge. SEO rewards on-page optimization and link velocity. AI visibility rewards consistent presence in the publications AI models trained on.

Do small healthtech startups have any chance against incumbents in AI visibility?

Yes, and often more than they have in traditional SEO. Incumbent visibility in AI is anchored to specific citation sources, not domain authority alone. A focused 90-day campaign in healthcare-native trade publications can shift a startup’s mention rate dramatically because the citation graph in healthtech is narrower and more discoverable than the broader B2B SaaS landscape.

How does HIPAA affect AI visibility work?

HIPAA doesn’t restrict your ability to publish category commentary, market analysis, or product positioning. It restricts how you talk about specific patients, PHI, and BAAs. Earned media built around workflow, integration architecture, and operational metrics stays well clear of HIPAA boundaries. The teams that struggle here usually conflate HIPAA with general communications caution.

What’s the right budget for healthtech AI visibility in 2026?

Most healthtech companies serious about this commit between $8K and $25K monthly across PR, content, and earned media work, depending on category competitiveness and the cost of in-house clinical SME time. Lower than that, and you can’t sustain the cadence required for citation patterns to compound. Higher than that usually means the team is buying broader brand strategy work rather than AI visibility specifically.

The Citation Gap Closes Faster Than You Think

The healthtech companies that AI assistants confidently recommend in 2026 aren’t the ones with the biggest marketing budgets. They’re the ones that recognized 18 months ago that AI search would reshape vendor consideration, built the entity and citation foundation early, and kept showing up across the publications AI models actually trust. That window is still open. It won’t be in 12 months.

Run the prompt audit this week. Ask ChatGPT, Perplexity, and Gemini the five most important questions a hospital VP, payer executive, or health system CIO would ask when shortlisting vendors in your category. Document which brands get named, which sources get cited, and where you sit. That single hour tells you whether the rest of this playbook is urgent or routine for your team. For most healthtech companies, the answer is urgent.

If you want a deeper read on related territory, the AI Visibility for B2B SaaS playbook covers the entity and citation mechanics that apply across categories, and the fintech version shows how regulated-industry teams handle the compliance-meets-visibility tension. For tactical work on tracking mentions across AI surfaces, see our guide on tracking brand mentions across AI search platforms.