


You translate the page into German, add the hreflang tags, and wait for the German version to perform like the English one.
It doesn’t, and the reason has almost nothing to do with the translation.
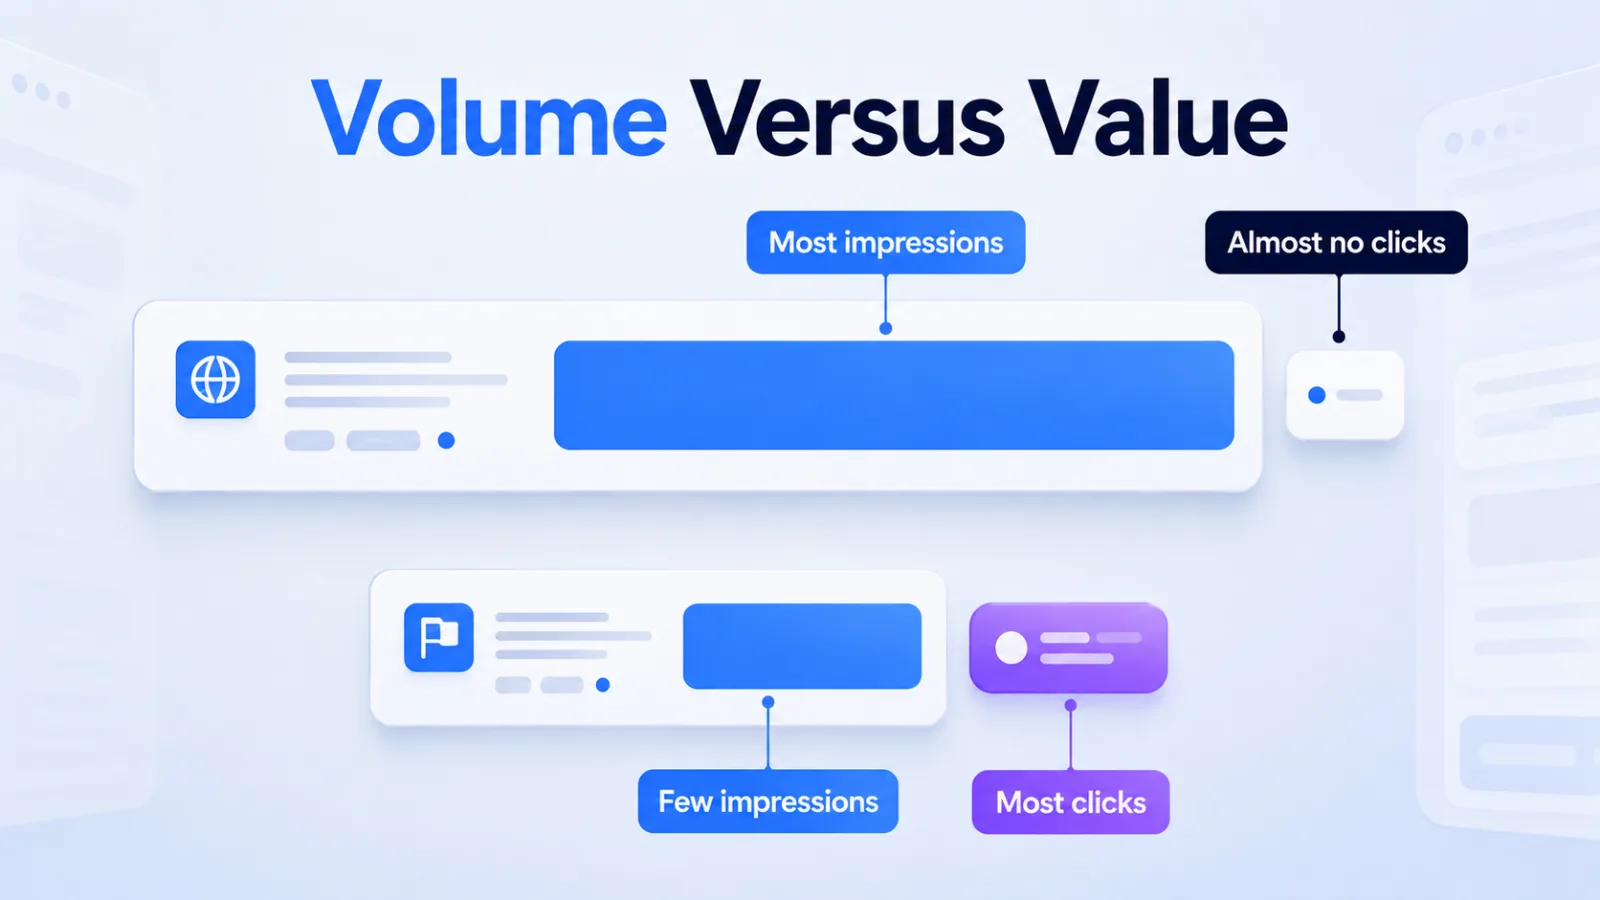
The same content ranks in a different place in every market, and the market sending you the most impressions is often your worst one. On this site the United States accounts for 62.7% of impressions and converts at 0.02%. India accounts for 1.3% and converts at 0.43%.
Twenty-one times the click rate, from a market we never targeted.
Scaling GEO across regions is a market-selection problem before it’s a language problem. Pick the wrong markets and translation multiplies the mistake.
What the Country Split Looks Like
Two countries carry three quarters of the impressions and almost none of the value.
| Country | Impressions | Share | Clicks | Avg position |
|---|---|---|---|---|
| United States | 97,514 | 62.7% | 17 | 53.2 |
| United Kingdom | 19,078 | 12.3% | 6 | 56.3 |
| Germany | 3,847 | 2.5% | 2 | 54.1 |
| Netherlands | 3,772 | 2.4% | 2 | 61.0 |
| India | 2,077 | 1.3% | 9 | 51.8 |
| France | 2,064 | 1.3% | 0 | 33.5 |
| Ireland | 1,008 | 0.6% | 0 | 25.1 |
That’s 90 days across 165 countries, 155,627 impressions and 68 clicks, with the bot query families stripped out before counting.
136 of those 165 countries produced impressions and zero clicks.
Why the impression leader is the weak market
It’s weak because impressions follow market size and clicks follow relevance.
A large English-speaking market will generate volume for almost any English page, including pages that answer a question nobody in that market was asking. Volume without intent looks like success in a dashboard and produces nothing.
The pattern is the same one behind query fan-out. Impressions get cheap when machines and broad matching are generating them, so the metric stops meaning what it used to.
Position Is Not One Number
Average position is 165 different numbers wearing one label.
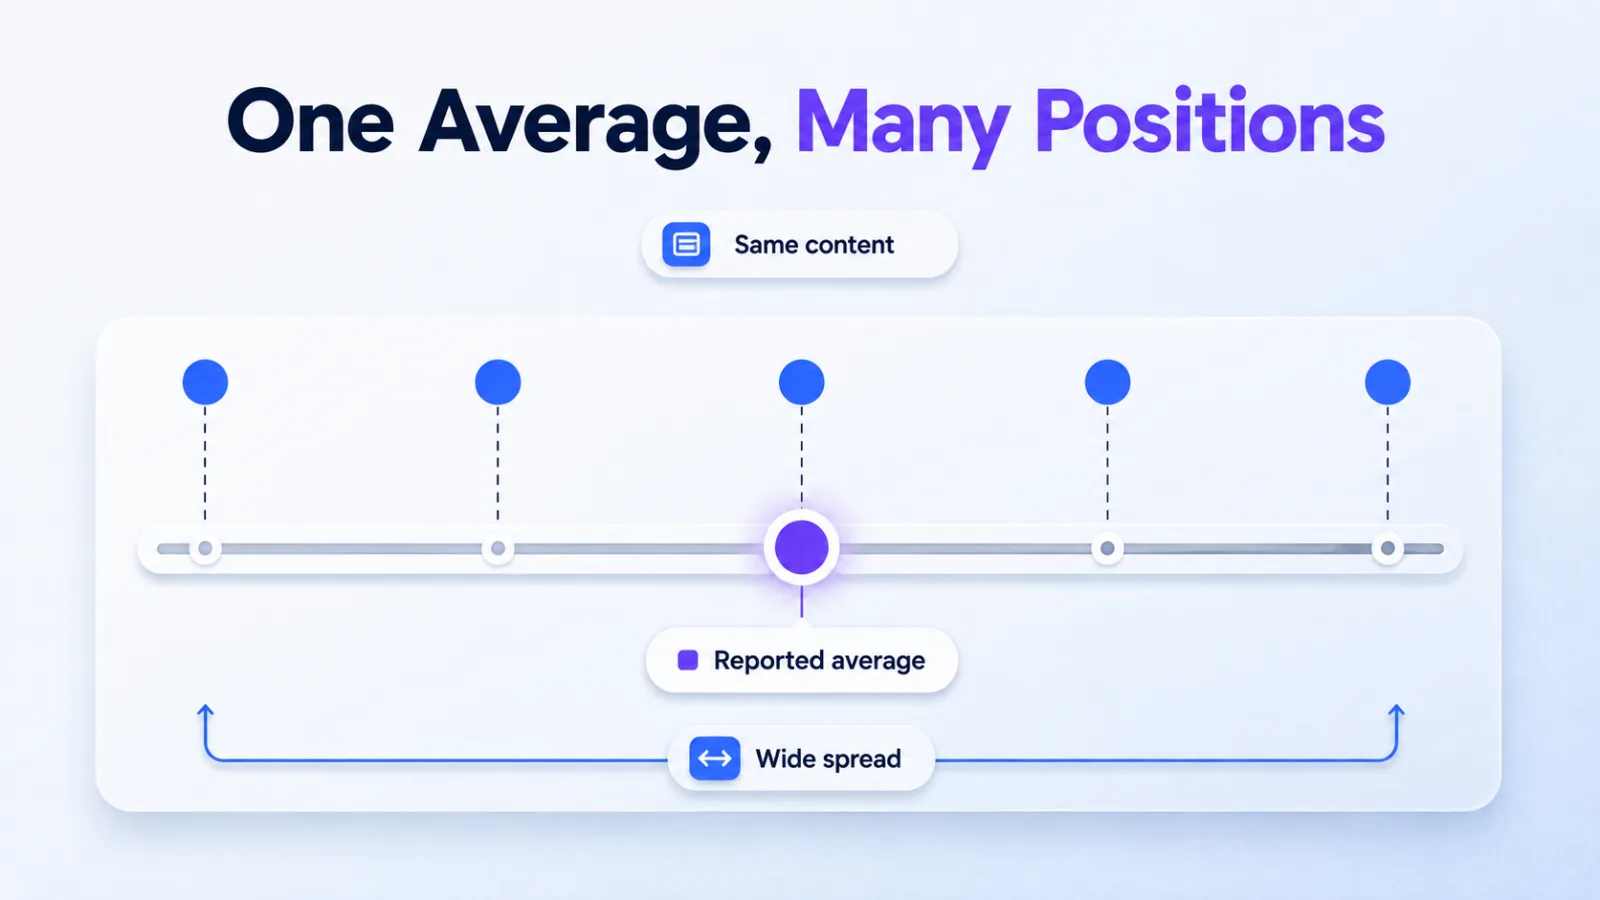
The same pages sit at 25.1 in Ireland, 33.5 in France, 53.2 in the United States and 63.8 in Poland.
That’s a 38-place spread on identical content, with no translation involved in most of it.
Reporting one global average across that range hides every decision worth making. A market at position 25 needs a nudge. A market at position 60 needs a different page or no page at all.
Machines Localise the Question Too
Localisation isn’t only something you do. It’s something the systems querying you already do on their own.
One prompt template showed up in our Search Console fanned across eleven countries, identical apart from the country name.
It read “share of voice tools pricing reviews comparison for b2b tech in”, with the country swapped each time.
Australia, France, Germany, Great Britain, India, Israel, Japan, Lithuania, Netherlands, Spain, United States.
445 impressions across the set. Zero clicks.
Nobody typed those. Something generated the same comparison question once per market, which is what regional scaling looks like from the other side of the wire. The same behaviour shows up in your own server logs.
What that changes
It changes the unit of work. You aren’t optimising a page for a language, you’re competing in a separate retrieval contest per market, run on your behalf.
A translated page that answers the English question in German still loses that contest, because the question was localised and the answer wasn’t.
This is the practical difference between ranking work and retrieval work, which we drew out in SEO vs GEO. Ranking is one contest per query. Retrieval is one per market, per phrasing, per engine.
What to Do Instead of Translating
Pick markets on click behaviour, not impression volume, then build for the two or three that show intent.
Rank your markets by clicks per impression
Sort Search Console by country and divide clicks by impressions. The order will not match the impression order, and the mismatch is the finding.
India outperformed the United States on this site by 21 times on that measure, which is a signal worth acting on even though the click counts are small.
Fix position before you add languages
A market at position 55 doesn’t have a language problem. Adding a translated page there multiplies a page that wasn’t working.
Markets already inside the top 30 are the ones where localisation pays, because they’re close enough that relevance decides the outcome. What decides it is covered in how AI crawlers pick sources.
Localise the question, not the sentences
Find how the buying question gets phrased in that market before writing anything. Currency, regulator names, procurement language and the local competitor set all change the question.
Translating your version of the question produces a page that answers something nobody asked in that language.
What This Data Doesn’t Show
These are Google Search Console numbers, so they describe classic search, not what an AI assistant says about you in Berlin.
No public tool reports AI answer visibility by country at this level, and anyone quoting you a per-market AI citation share is estimating it. Measuring that still means asking the systems directly, per market, which is the method in tracking brand mentions in AI search.
The click counts here are also small. Sixty-eight clicks across 165 countries means the per-market rates are directional, not precise, and we’d treat a single quarter of them as a hypothesis rather than a plan.
Frequently Asked Questions
Does hreflang help with AI search
It helps the classic index understand which version belongs to which market, and there’s no evidence it influences which page an AI assistant cites.
Set it correctly because it’s cheap and it prevents duplicate-content confusion. Don’t expect it to move AI citations.
Should I translate my best-performing page first
Only if the target market already ranks reasonably for the English version.
A page that sits at position 55 in a market is failing on relevance or authority, and translating it carries both problems into a new URL.
Which markets should a small team pick
Two, chosen by click rate rather than impression share, and ideally ones where you already sit inside the top 30.
Three or more markets means maintaining three content sets, and most teams that try it end up with three neglected ones.
Why do some countries show a much better average position
They do because there’s less competition for the same queries in smaller markets, so the same page places higher without being any better.
A strong position in a market with no buyers isn’t worth chasing. Check whether the market has commercial intent before you invest in it.
Is share of voice measured per country
It should be, and most tools report it globally by default.
A global share-of-voice figure averages a market where you’re invisible with one where you lead, and the average describes neither. We covered the measurement side in share of voice tools.
Rank Your Markets Before Your Next Translation
Open Search Console, switch to the country view, and sort by clicks divided by impressions instead of by impressions.
The market at the top is probably not the one your roadmap is built around. Start there, fix position before adding a language, and leave the other 160 alone.
If you want that run across markets alongside the citation work, our enterprise citations programme covers it.