
Share of voice (SOV) measures how much of the conversation your brand owns in a category. Share of market (SOM) measures how much of the revenue you capture. One predicts where you’re headed. The other confirms where you’ve been. Understanding the gap between them — and acting on it — is the single most reliable lever for sustained growth in 2026.
Most marketing teams track one or the other. Few track both in a way that drives real decisions. That’s a problem, because the relationship between SOV and SOM is one of the most well-documented predictors of future market share movement in marketing science. And as of 2026, the channels that define “voice” have expanded well beyond paid media — into organic search, social conversations, editorial coverage, and now AI-generated recommendations.
This article breaks down how each metric works, how to calculate them accurately, what the research says about their relationship, and how to apply the SOV-SOM framework to your 2026 growth strategy — including the AI visibility dimension most brands still overlook.
What You’ll Learn
- The precise definitions of share of voice and share of market — and why conflating them leads to bad strategy
- How to calculate SOV across paid, organic, social, and AI channels in 2026
- The Excess Share of Voice (ESOV) principle and what Binet & Field’s research means for your budget
- Why the SOV-SOM gap is the best leading indicator of market share growth or decline
- How AI search engines have created a new SOV battleground most competitors ignore
- A practical framework for setting SOV targets based on your growth ambitions
- Common measurement pitfalls that make these metrics misleading
What Is Share of Voice?
Share of voice is your brand’s proportion of total visibility within a defined category, measured across the channels where your audience discovers, evaluates, and discusses solutions. The formula is straightforward:
SOV = (Your Brand’s Visibility ÷ Total Category Visibility) × 100
Historically, SOV referred almost exclusively to advertising spend — your media dollars as a percentage of total category ad spend. That definition, while still relevant for media planning, is far too narrow for 2026.
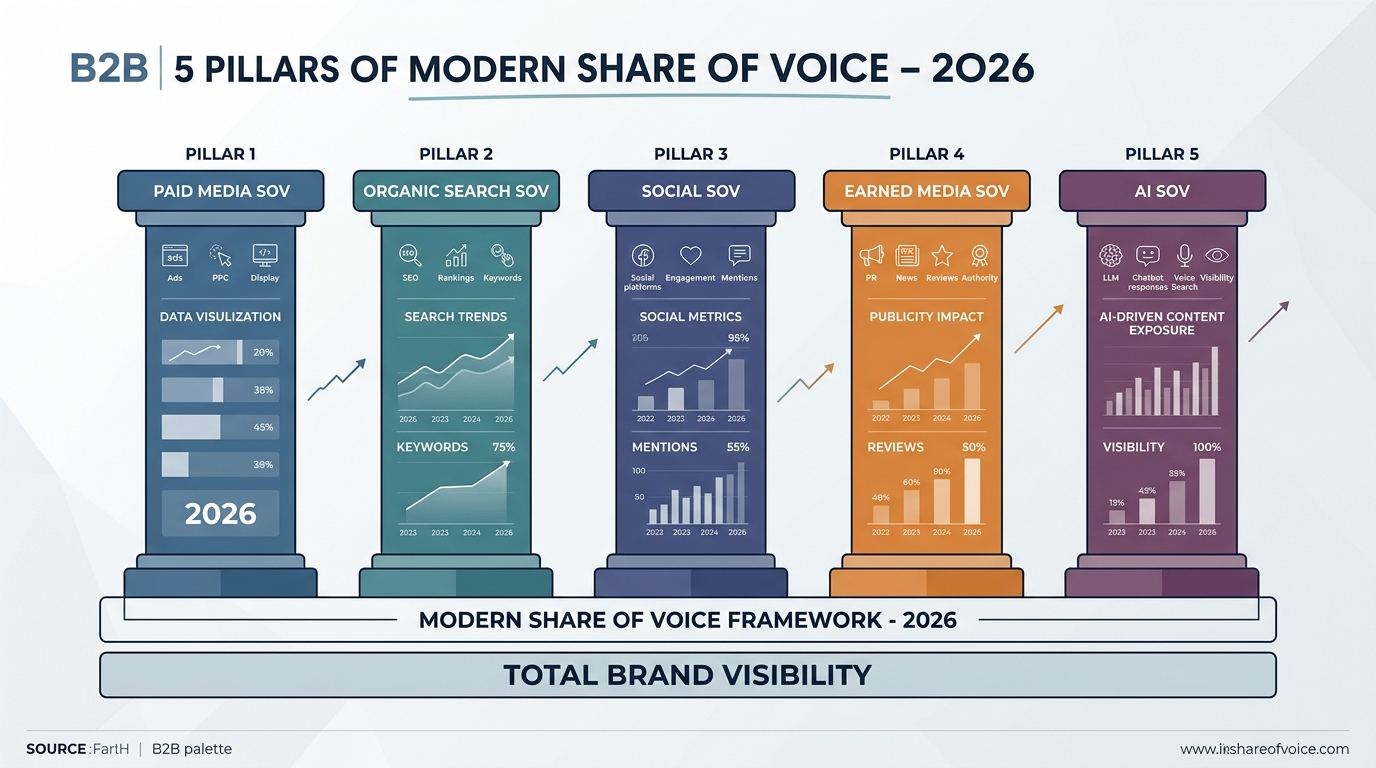
Today, share of voice spans multiple dimensions:
- Paid media SOV: Your ad impressions or spend relative to total category spend (the traditional definition)
- Organic search SOV: Your share of clicks and rankings for non-branded category keywords
- Social SOV: Your share of brand mentions, engagement, and conversation volume across social platforms
- Earned media SOV: Your share of editorial coverage, PR mentions, and third-party reviews
- AI SOV: How frequently AI assistants — ChatGPT, Gemini, Perplexity, Claude, Copilot — cite or recommend your brand when users ask category-relevant questions
Each dimension measures a different layer of brand salience. The sum of these layers reflects how much mindshare your brand occupies in the market — which, as the research shows, directly influences future purchase behavior.
What Is Share of Market?
Share of market is your brand’s revenue (or unit sales) as a percentage of total category revenue. The formula:
SOM = (Your Revenue ÷ Total Market Revenue) × 100
SOM is a lagging indicator. It tells you what already happened — how much of the category’s total sales your brand captured over a defined period. It is the scoreboard, not the playbook.
Calculating SOM requires two inputs:
- Your revenue: This is the easy part. You know your own numbers.
- Total market revenue: This is harder. Sources include industry reports from Gartner, Forrester, Statista, and trade associations. For public companies, competitor financial filings help. For private markets, estimates from research firms or government economic data are often the best available option.
The key rule for SOM measurement: define your market consistently. If you change the definition of your total addressable market every quarter — broadening it when growth looks strong, narrowing it when it doesn’t — the metric becomes meaningless. Pick a defensible definition and stick with it.
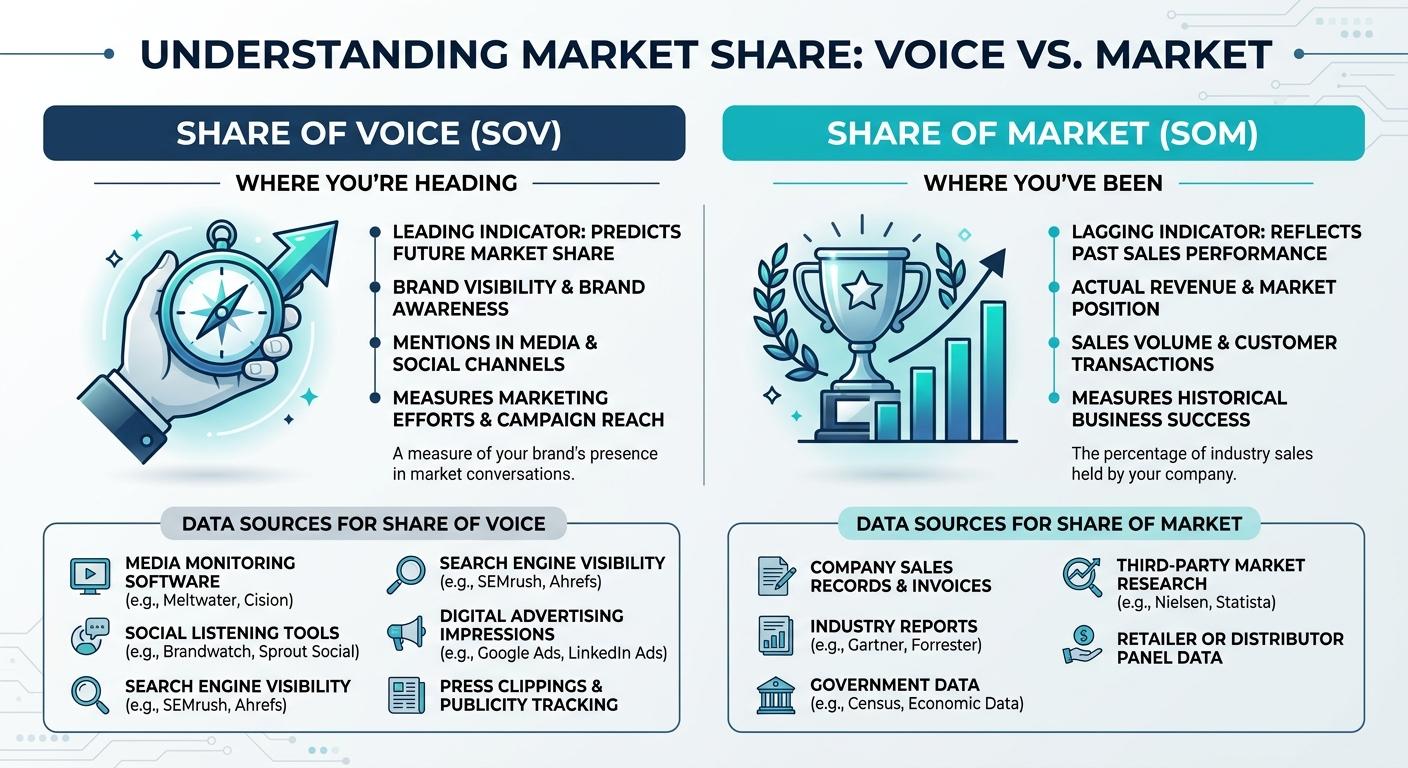
How Do Share of Voice and Share of Market Differ?
The core distinction is time orientation. SOV is forward-looking. SOM is backward-looking. One measures attention. The other measures revenue.
| Attribute | Share of Voice (SOV) | Share of Market (SOM) |
|---|---|---|
| What it measures | Brand visibility and conversation share across channels | Revenue or unit sales as a percentage of total market |
| Indicator type | Leading indicator — predicts future performance | Lagging indicator — reports past performance |
| Data sources | Ad impressions, keyword rankings, social mentions, editorial coverage, AI citations | Sales figures, revenue reports, industry research |
| Measurement cadence | Weekly to monthly | Quarterly to annually |
| Strategic purpose | Set investment levels, identify growth opportunities, benchmark brand salience | Evaluate competitive position, report on business performance |
| Actionability | High — you can adjust channels, content, and spend to shift SOV | Low in real-time — SOM shifts slowly as a result of sustained effort |
Tracking SOM without SOV is like reviewing your last exam grade without studying for the next one. Tracking SOV without SOM means you’re measuring noise without confirming it converts to revenue. You need both — but the strategic leverage sits in the gap between them.
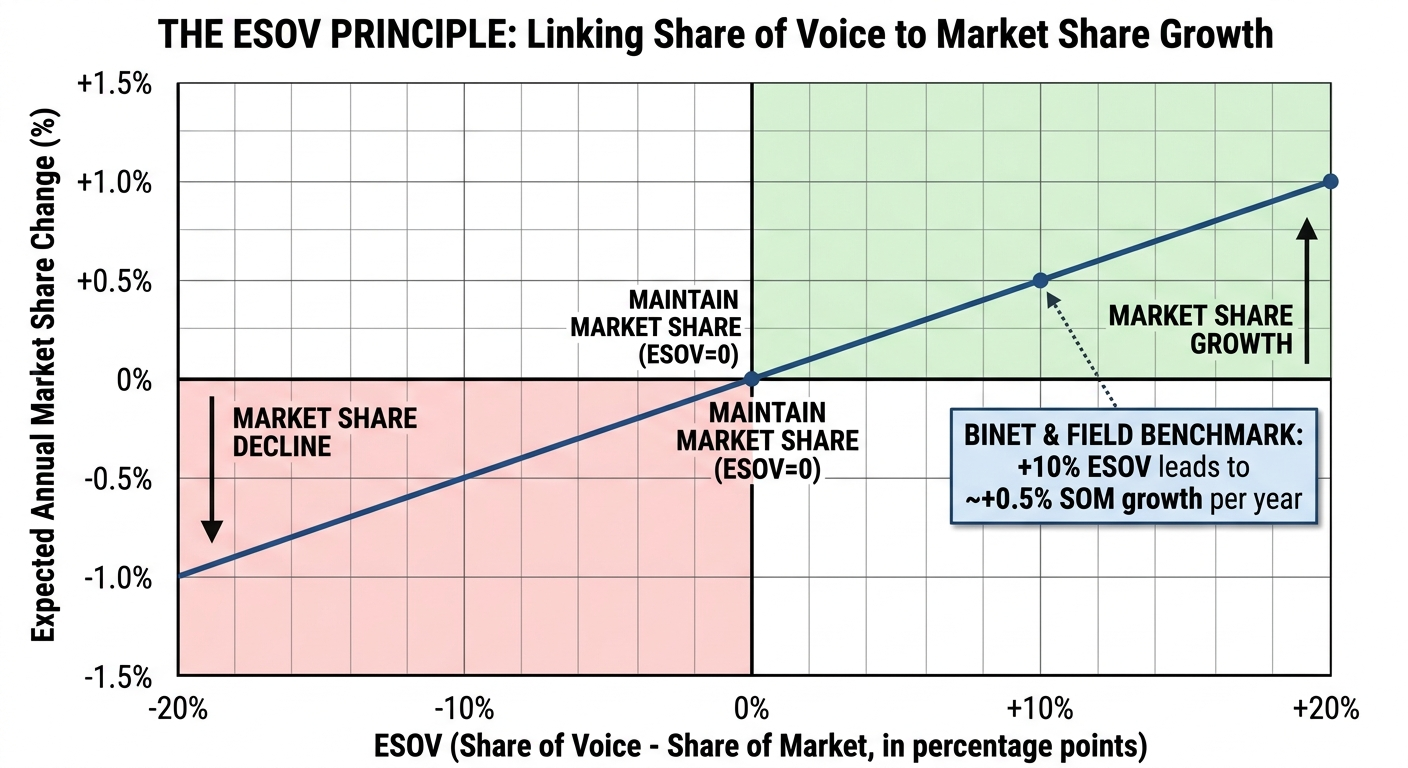
The ESOV Principle: Why the Gap Between SOV and SOM Predicts Growth
The relationship between share of voice and share of market isn’t theoretical. It’s one of the most rigorously validated findings in marketing effectiveness research.
Excess Share of Voice (ESOV) is the difference between your SOV and your SOM. If your SOV exceeds your SOM, you have positive ESOV. If it falls below, you have negative ESOV.
The principle is simple:
- Positive ESOV → market share growth. You’re investing in more visibility than your current revenue position warrants. Over time, that attention converts to sales.
- Negative ESOV → market share decline. You’re underinvesting relative to your current position. Competitors fill the gap.
- Zero ESOV → market share maintenance. Your visibility matches your revenue share. You hold steady.
What the Research Shows
Les Binet and Peter Field analyzed the IPA Databank — a dataset spanning hundreds of advertising campaigns across multiple categories from 1980 to 2010 — and found a consistent statistical relationship: for every 10 percentage points of ESOV, a brand can expect approximately 0.5% of market share growth per year, according to their analysis published by the Institute of Practitioners in Advertising (IPA).
Nielsen’s advertising intelligence research has independently validated this directional finding, noting that brands with sustained ESOV above their SOM tend to grow, while brands that allow SOV to fall below SOM tend to lose share over time, as documented in Nielsen’s 2025 advertising effectiveness reports.
The effect isn’t instant. ESOV works through mental availability — the probability that your brand comes to mind when a buyer enters the market. Building mental availability takes consistent investment over months and years, not weeks.
Why ESOV Matters More for Challenger Brands
The ESOV principle is especially powerful for brands with small market share. A startup with 3% SOM that achieves 13% SOV has a +10-point ESOV — a strong growth signal. A market leader with 35% SOM would need to spend to 45% SOV to achieve the same ESOV, which is far more expensive in absolute terms.
This is why challenger brands can grow disproportionately fast with smart SOV strategies. They don’t need to outspend incumbents in absolute dollars. They need to outspend them relative to their current market position.
How to Calculate Share of Voice Across Channels in 2026
Measuring SOV accurately requires channel-specific approaches. Here’s how to calculate each dimension.
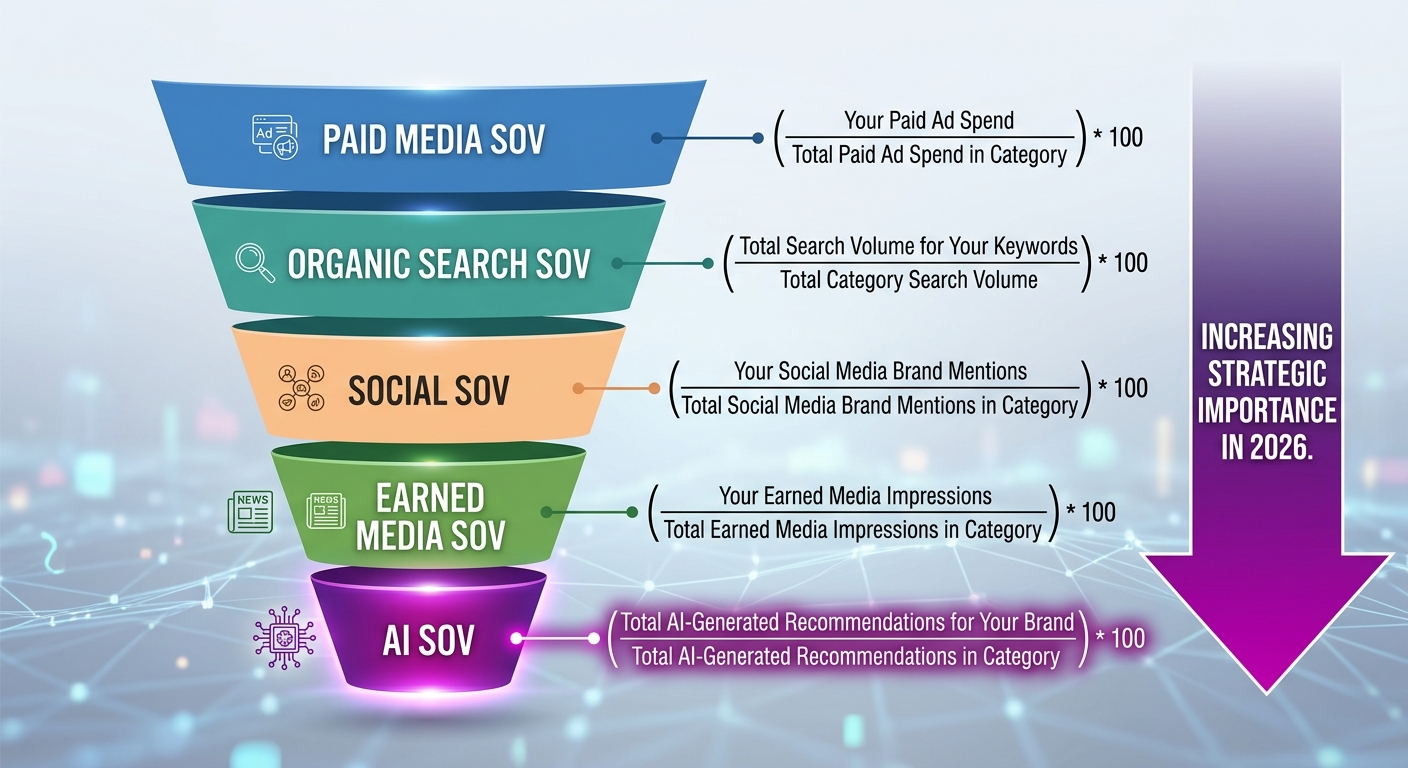
Paid Media SOV
The most traditional form. Use Google Ads’ Impression Share metric for search campaigns — it tells you what percentage of available impressions you captured. For display and social ads, compare your impression volume against estimated category totals using platform reporting or competitive intelligence tools.
Formula: Your Ad Impressions ÷ Total Available Impressions in Category = Paid SOV
Organic Search SOV
Track your visibility for a defined set of non-branded, category-relevant keywords. Tools like Ahrefs and Semrush offer “share of voice” features that calculate your estimated share of organic clicks based on keyword rankings and search volume.
Formula: Your Estimated Organic Clicks for Category Keywords ÷ Total Estimated Clicks for Those Keywords = Organic SOV
This dimension has become increasingly important as organic search drives high-intent traffic. If you’re already conducting SEO competitor analysis, you likely have the data to calculate organic SOV.
Social Media SOV
Measure your brand’s mention volume, engagement, and conversation share across relevant platforms. Social media monitoring tools automate this by tracking mentions of your brand and competitors across platforms like LinkedIn, X, Reddit, and industry-specific communities.
Formula: Your Brand Mentions ÷ Total Category Mentions (You + Competitors) = Social SOV
Volume alone isn’t enough. Pair mention counts with brand sentiment analysis to ensure your SOV reflects positive or neutral visibility — not crisis-driven spikes.
Earned Media SOV
Track how often your brand appears in editorial publications, news articles, podcast features, and review sites relative to competitors. Brand mention tools and media monitoring platforms can automate this tracking across thousands of publications.
Formula: Your Editorial Mentions ÷ Total Category Editorial Mentions = Earned Media SOV
AI Share of Voice: The 2026 Frontier
This is the dimension most brands still don’t measure — and it may be the most consequential for long-term growth.
When a user asks ChatGPT, Gemini, Perplexity, or Claude a category-relevant question (“What’s the best project management tool for remote teams?”), the AI’s response creates a new form of brand visibility. AI share of voice measures how often your brand appears in these AI-generated answers relative to competitors.
Unlike traditional search — where you can track rankings with standard SEO tools — AI visibility requires specialized monitoring. You need to systematically query AI platforms with category-relevant prompts and track which brands appear in responses, how frequently, and in what context.
As of 2026, according to a 2025 Gartner forecast, AI-driven search and recommendation engines are expected to influence an increasing share of B2B and B2C purchase decisions. Brands that build visibility in AI training data and retrieval systems now are positioning themselves for the next wave of market share growth. For a deeper look at how this works, see how brand mentions impact visibility in AI search.
Pro Insight: Most brands calculate SOV for only one or two channels. In 2026, a complete SOV picture requires measuring all five dimensions — paid, organic, social, earned, and AI. Gaps in measurement create blind spots where competitors gain ground undetected.
How to Set SOV Targets Based on Your Growth Goals
The ESOV principle gives you a practical budgeting framework. Your SOV target should be driven by your growth ambition, not by what’s left over after other expenses.
Three Strategic Scenarios
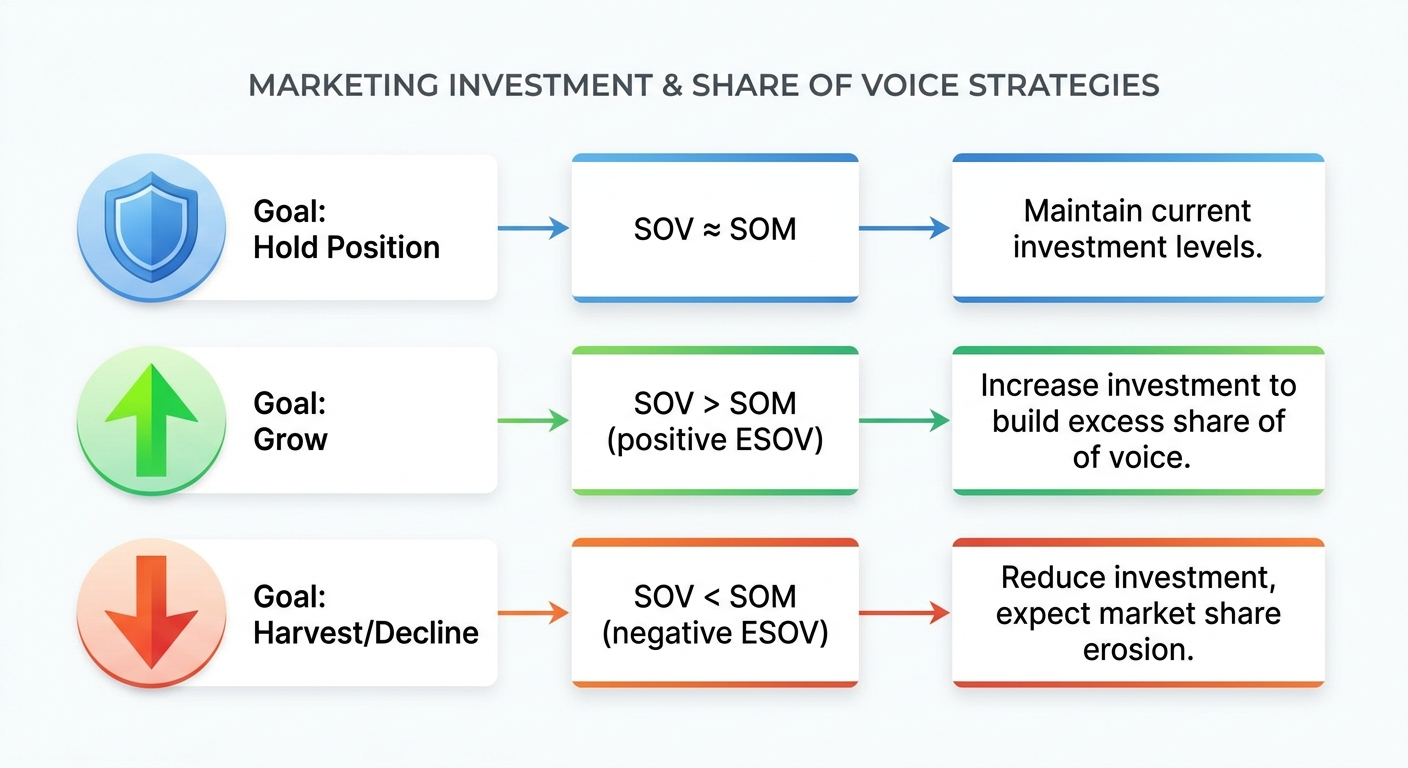
1. Hold your current market share (Equilibrium): Set your SOV target roughly equal to your SOM. If you have a 12% market share, aim for approximately 12% SOV across your key channels. This is defensive spending — enough to maintain mental availability without investing in growth.
2. Grow your market share (Positive ESOV): Set your SOV target above your SOM. Based on the Binet & Field benchmark, every +10 points of ESOV should yield approximately +0.5% of SOM growth annually. If you have an 8% SOM and want to grow, targeting 15-18% SOV creates the conditions for market share gains.
3. Accept market share decline (Negative ESOV): If you allow your SOV to fall below your SOM — whether through budget cuts, competitive pressure, or neglect — expect gradual erosion. This isn’t always wrong (harvesting a declining product line may be intentional), but it should be a conscious strategic decision, not an accident.
Translating SOV Targets Into Budget
Converting a SOV percentage into actual spend requires competitive intelligence. You need to estimate how much your competitors invest across the channels that matter.
Steps to build a SOV-based budget:
- Define your competitive set. Identify the 3-5 brands whose visibility you’re competing against. This isn’t always the same as your direct revenue competitors.
- Estimate total category visibility. Use competitive intelligence tools to approximate total ad spend, organic visibility, social mention volume, and earned media coverage in your category.
- Calculate the investment required for your target SOV. If total category paid media spend is $50M annually and you want a 15% paid SOV, that’s $7.5M. Apply the same logic to organic (content investment), social (community and content), earned (PR and editorial), and AI (citation building).
- Prioritize channels with the best SOV-to-SOM conversion. Not every SOV dollar converts equally. Invest more heavily in channels where your target audience makes purchase decisions.
Conducting thorough competitor analysis is essential here. Without visibility into what your competitors are doing, your SOV targets are guesswork.
How AI Search Has Changed the SOV-SOM Equation
The SOV-SOM framework was built in the era of TV advertising and print media. The underlying principle — that visibility drives future sales — still holds. But the surfaces where visibility matters have expanded dramatically.
As of 2026, AI assistants influence a growing share of product research, vendor evaluation, and purchase decisions. When a VP of Marketing asks ChatGPT “What agencies help with brand visibility?” or a procurement officer asks Perplexity “Best enterprise CRM platforms?” — the brands named in those responses gain meaningful SOV.
This shift has three implications for your SOV-SOM strategy:
1. AI Visibility Is a New SOV Channel With Outsized Influence
AI-generated recommendations carry implicit endorsement. When an AI names your brand alongside — or ahead of — competitors, it functions like a trusted referral. The conversion potential of AI SOV may exceed that of traditional display advertising, where users expect self-promotional messaging.
Agencies like BrandMentions address this by placing contextual brand mentions across 140+ high-authority publications that AI models actively learn from during training and retrieval cycles. This editorial presence builds the entity authority that AI systems use to determine which brands to cite.
2. AI SOV Compounds Differently Than Paid SOV
Paid media SOV stops the moment you stop spending. AI SOV, by contrast, builds over time as editorial mentions accumulate in the datasets AI models reference. A brand mention in a high-authority publication can influence AI responses for months or years after publication — similar to how a strong backlink profile compounds organic search authority.
This makes AI visibility investment more analogous to content marketing or SEO than to paid advertising. The returns are slower to materialize but longer-lasting.
3. Most Competitors Aren’t Measuring AI SOV Yet
According to a 2025 survey by Sparktoro, the majority of marketing teams still do not systematically track their brand’s presence in AI-generated responses. This creates an asymmetric opportunity: brands that track brand mentions across AI search platforms and invest in AI visibility now can build ESOV in a channel where competition is still thin.
Think of it like early SEO in the 2000s. The brands that invested before competitors recognized the channel’s importance captured dominant positions that proved difficult to dislodge later.
Common Measurement Mistakes That Distort Your SOV-SOM View
The SOV-SOM framework is powerful, but only if your data is accurate. Several common errors can make these metrics misleading.
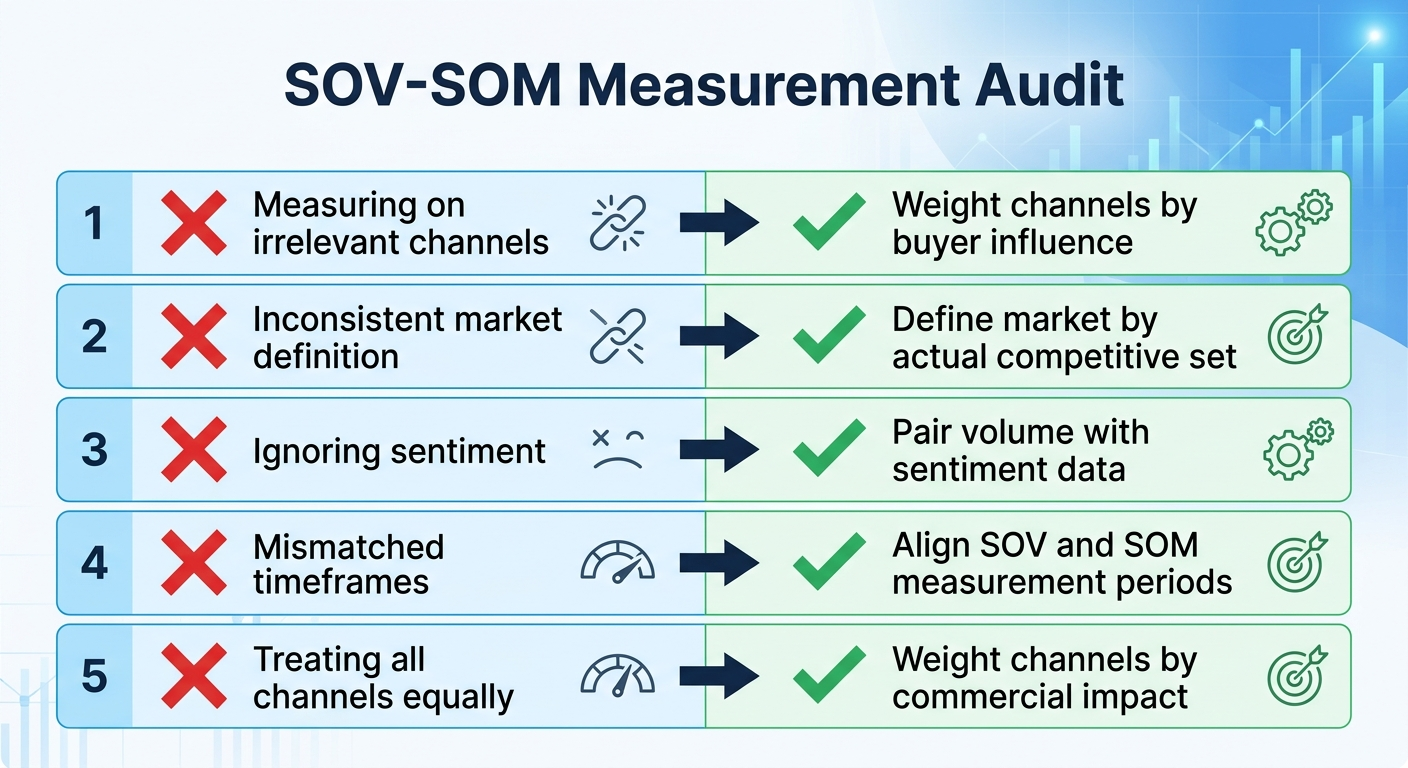
Measuring SOV on channels that don’t influence your buyers
A B2B SaaS company measuring its social SOV on Instagram is probably tracking vanity metrics. If your buyers make decisions based on LinkedIn conversations, analyst reports, and AI search results, your SOV measurement should weight those channels accordingly.
Fix: Map your buyer’s decision journey first. Identify the 2-3 channels that most influence purchase decisions. Measure SOV there with precision rather than everywhere with superficiality.
Defining the market too broadly or too narrowly
If you define your total addressable market too broadly, your SOM will look artificially small. Too narrowly, and it looks artificially large. Both distortions break the ESOV calculation.
Fix: Define your market based on the set of competitors your actual buyers evaluate when making a purchase decision. This is your relevant competitive set — not the entire industry.
Ignoring sentiment when measuring SOV
A PR crisis can spike your brand mentions dramatically. Your social SOV might hit 40% — and every mention might be negative. Raw volume without sentiment context creates a false picture of brand salience.
Fix: Always pair SOV volume with sentiment analysis. Brand sentiment analysis tools can automate this, flagging when high SOV is driven by negative rather than positive or neutral visibility.
Measuring SOV and SOM at mismatched intervals
SOV can shift weekly. SOM typically moves quarterly or annually. Comparing a single week’s SOV spike to an annual SOM figure creates misleading conclusions about your ESOV position.
Fix: Measure SOV on a rolling monthly or quarterly basis and compare it to SOM over the same period. Consistency in timeframes is more important than precision in any single data point.
Treating all SOV channels as equal
A thousand social mentions may drive less commercial impact than ten mentions in high-authority publications that AI models reference. Not all visibility is equally valuable.
Fix: Weight your SOV channels based on their proximity to purchase decisions. Top-of-funnel visibility (social awareness) matters, but bottom-of-funnel visibility (AI recommendations, review sites, analyst coverage) often has a higher conversion rate.
A Practical SOV-SOM Audit You Can Run This Quarter
Theory is useful. Execution is what changes your market position. Here’s a quarterly audit process you can implement immediately.
Step 1: Calculate your current SOM
Pull your most recent quarterly revenue. Source total market revenue from industry reports, competitor filings, or research firms. Calculate your SOM percentage.
Step 2: Calculate your SOV across key channels
For each channel relevant to your buyer’s decision process:
- Paid: Pull Impression Share from Google Ads and any social ad platforms you use
- Organic: Use SEO tools to calculate your share of organic clicks for category keywords
- Social: Use brand monitoring tools to count your mentions vs. competitor mentions
- Earned: Track editorial mentions across publications using brand mentions monitoring
- AI: Query ChatGPT, Gemini, and Perplexity with 10-15 category-relevant prompts. Record which brands appear. Calculate your share of AI recommendations. Tools for checking if AI mentions your brand can help automate this.
Step 3: Calculate your ESOV
Subtract your SOM from your blended SOV. A positive number means you’re positioned for growth. A negative number signals risk.
Step 4: Set channel-specific SOV targets for the next quarter
Based on your growth goal — hold, grow, or harvest — set specific SOV targets for each channel. Allocate budget and effort accordingly.
Step 5: Measure again next quarter and track the trend
The power of the SOV-SOM framework is in the trend, not any single snapshot. Quarter-over-quarter ESOV movement tells you whether your investments are building or eroding your future market position.
Tip: Don’t wait for perfect data to start this audit. Even rough estimates of competitor visibility are more useful than no competitive benchmarking at all. Refine your data sources each quarter as you build the practice into your brand tracking routine.
Frequently Asked Questions
Does share of voice directly cause market share growth?
SOV doesn’t cause growth directly. It builds mental availability — the probability that your brand comes to mind when a buyer enters the market. That mental availability, sustained over time, converts to purchase behavior and market share growth. The Binet & Field IPA research demonstrates this as a strong statistical correlation, not a guaranteed causal mechanism. Other factors — product quality, pricing, distribution — also influence whether attention converts to revenue.
How often should I measure share of voice vs. share of market?
Measure SOV monthly or weekly for fast-moving digital channels (social, paid, AI). Measure SOM quarterly, since market-level revenue data updates slowly. Compare ESOV on a quarterly basis to identify meaningful trends rather than short-term noise.
Can a small brand with a limited budget compete on share of voice?
Yes — and the ESOV principle actually favors smaller brands. A startup with a 2% SOM that achieves a 10% SOV in targeted channels has a strong +8-point ESOV. The key is channel selection. Dominating SOV in a specific niche — a focused subreddit, a set of high-authority industry publications, or AI search results for long-tail category queries — often delivers more growth than spreading a thin budget across broad channels.
What role do AI search engines play in share of voice as of 2026?
AI assistants like ChatGPT, Gemini, Perplexity, and Claude represent a new SOV channel with growing influence on purchase decisions. When an AI recommends your brand in response to a category question, that visibility carries implicit trust — similar to an expert referral. Most brands don’t measure AI SOV yet, creating an opportunity for early movers to build brand presence in AI before competition intensifies.
Is the Binet & Field ESOV research still valid in 2026?
The original IPA research analyzed campaigns primarily in FMCG and consumer categories. The core principle — that excess visibility predicts growth — has been validated across additional categories, including B2B, in subsequent studies. However, the specific “+10 ESOV = +0.5% SOM” benchmark varies by industry, competitive density, and sales cycle length. Use it as a directional guide, not a precise multiplier for every market.
What’s the difference between share of voice and share of search?
Share of search, a concept popularized by Les Binet and James Hankins, uses branded search volume as a proxy for SOV. It measures how often people search for your brand name relative to competitor brand names. Share of search has the advantage of being easy to access (Google Trends data is free) and has shown strong correlation with market share movement. It’s best understood as one component of a broader SOV measurement — specifically, a proxy for overall brand salience that can supplement channel-specific SOV metrics.
Where This Leaves Your 2026 Strategy
The share of voice vs. share of market framework isn’t a new concept. What’s new is the expanded surface area where “voice” is earned — particularly in AI-generated search results and recommendations. Brands that measure SOV only in paid media are using an incomplete map.
Your action steps are clear:
- Measure both SOV and SOM consistently, using the same market definition over time
- Calculate your ESOV quarterly to understand whether you’re positioned for growth or decline
- Expand your SOV measurement to include AI visibility — a channel where most competitors are still blind
- Set SOV targets that match your growth ambition, then allocate budget to close the gap
- Track the trend over multiple quarters — ESOV’s predictive power comes from sustained investment, not one-time spikes
If you’re unsure where your brand stands in AI search results — or how your competitors are showing up — see where your brand ranks in AI recommendations. Understanding your AI share of voice is the first step toward building the visibility that compounds into market share.