Share of voice search, Your brand ranks for dozens of keywords. Maybe hundreds. But ranking doesn’t tell you whether you’re winning, or just showing up. Share of voice in search measures the percentage of total organic visibility your brand captures across a defined set of keywords, compared to every competitor fighting for the same clicks. It’s the difference between knowing your position on a single keyword and knowing your position in the entire category.
Most teams track rankings keyword by keyword and miss the bigger signal. One competitor quietly dominates 40% of organic visibility in your space while you celebrate a page-one placement that accounts for 2% of total search volume. Share of voice in search exposes that gap, and gives you a single number to benchmark, track, and grow against.
This piece breaks down the exact formula, shows you how to measure it without drowning in spreadsheets, and walks through the tactics that actually shift organic share of voice in 2026, including the parts most guides skip entirely.
Quick Summary
- Share of voice in search = your estimated organic traffic from tracked keywords ÷ total possible organic traffic across those keywords × 100.
- It’s a better performance indicator than individual rankings because it weights keyword volume and click-through rates into a single metric.
- Brands with organic share of voice higher than their market share tend to grow, those below it tend to shrink.
- You don’t need enterprise tools to start. A focused keyword set of 50-200 terms gets you 80% of the insight.
- Growing share of voice in search requires category-level content strategy, not just page-level optimization.
The Formula Behind Search Share of Voice
Share of voice in search equals your brand’s estimated organic traffic from a defined keyword set, divided by the total estimated organic traffic available from that same keyword set, multiplied by 100. The result is a percentage that represents how much of the organic opportunity your brand captures versus everyone else.
The formula looks simple. The nuance is in how you estimate organic traffic. Raw search volume isn’t enough, you need to apply expected click-through rates based on ranking position. A keyword where you rank #1 delivers far more visibility than one where you sit at #8, even if the search volumes are identical.
Here’s how it works in practice:
- Define your keyword set (the terms that matter to your category, not just the ones you already rank for).
- For each keyword, pull monthly search volume.
- For each keyword, determine your ranking position and your competitors’ positions.
- Apply a CTR curve to estimate the traffic each position captures. Position #1 typically captures 25-32% of clicks. Position #5 drops to 5-7%. Below position #10, clicks are negligible for most queries.
- Sum the estimated traffic across all keywords for your brand. Divide by the total estimated traffic across all keywords for all competitors. Multiply by 100.
That’s your search share of voice.
A quick example: you track 100 keywords with a combined monthly volume of 500,000 searches. Based on your rankings and estimated CTRs, your brand captures an estimated 12,000 visits. The total estimated traffic available across all tracked competitors is 150,000 visits. Your share of voice is 8%.
The number alone means nothing. What matters is how it compares to your competitors, and how it moves month over month.
Why This Metric Outperforms Individual Rankings
Tracking keyword rankings one at a time creates a distorted picture. You can celebrate ranking #3 on a keyword with 200 monthly searches while a competitor quietly owns positions #1 and #2 across 30 high-volume terms in the same category. Individual rankings don’t tell you who’s winning the category. Share of voice does.
Three reasons this metric is more useful than rank tracking alone:
It weights what matters. Not all keywords are equal. A #1 ranking on a 50,000-volume keyword is worth more than #1 on fifty 100-volume keywords. Share of voice accounts for this by factoring in search volume and expected CTR. The result reflects real visibility, not a count of wins.
It reveals competitive dynamics you’d otherwise miss. Your rankings might hold steady while a competitor aggressively builds content around adjacent terms. Your rank report looks stable. Your share of voice is shrinking. That’s the kind of signal that prevents nasty surprises during quarterly reviews.

It predicts growth direction. Research from Les Binet and Peter Field across 171 campaigns found that brands with excess share of voice, meaning their visibility share exceeded their market share, tended to grow. The inverse also held: brands below parity tended to decline. In organic search, the same principle applies. If you own 15% of organic visibility in a category where you hold 10% market share, you’re pulling ahead. If your visibility drops to 5%, revenue eventually follows.
Picking the Right Keyword Set, Where Most Teams Go Wrong
Your share of voice number is only as good as the keywords you track. And this is where most teams introduce a fatal flaw: they only track keywords they already rank for.
That’s like measuring your market share by counting only the customers who already buy from you. It ignores the entire addressable market.
A useful keyword set for search share of voice should include:
- Your current winners, terms where you rank well. These show what you’re defending.
- Your competitors’ winners, terms where they rank and you don’t. These show the gap you need to close.
- Category-level terms, the broader informational and commercial queries people use when exploring your space, regardless of who ranks today. These represent the full opportunity.
A common mistake is including vanity keywords, terms your CEO likes or industry jargon nobody searches. These inflate your list without adding signal. Every keyword in the set should have meaningful search volume and clear category relevance.
For most B2B brands, a set of 50-200 keywords captures enough of the landscape to produce a meaningful share of voice number. Enterprise brands in competitive categories might track 500+. But more isn’t always better. A bloated keyword set with irrelevant terms dilutes the metric.
One thing we’ve found useful: segment your keyword set by intent type. Group your terms into informational (top-funnel awareness), commercial investigation (mid-funnel comparison), and transactional (bottom-funnel conversion). Then measure share of voice for each segment separately. A brand might dominate informational queries but have almost zero visibility on commercial terms, which is exactly where buying decisions happen. That segmentation changes how you prioritize content investment.
Tools That Measure Search Share of Voice
You don’t need to build spreadsheets and manually apply CTR curves. Several tools calculate search share of voice automatically, though they each define it slightly differently, which matters when you’re comparing numbers across platforms.
Semrush Position Tracking is the most widely used option. It calculates share of voice as your estimated organic traffic from tracked keywords divided by the combined search volume of those keywords. You set up a project, add your keyword list and competitors, and the tool tracks share of voice over time with trend lines. The keyword tagging feature lets you segment by topic or funnel stage. Solid for teams already in the Semrush ecosystem.
Ahrefs Rank Tracker takes a similar approach, showing visibility as a percentage of total tracked traffic. It’s strong for competitive comparison, you can add up to 10 competitors and see exactly where each one pulls ahead or falls behind. Ahrefs also factors in SERP features (featured snippets, knowledge panels, People Also Ask) that affect CTR, which makes the share of voice number more realistic.
SE Ranking, Sistrix, and AWR all offer share of voice or visibility index metrics. The formulas differ slightly, some weight by estimated CTR, others by impression share. The exact numbers aren’t directly comparable across tools, which is fine. What matters is consistency: pick one tool and track the trend over time. A rising share of voice in any of these tools means you’re gaining ground.
For teams on a tight budget, you can approximate search share of voice in Google Search Console. Pull your total impressions and clicks for category keywords over a set period. Compare your click share against the total impression pool. It’s rougher than a dedicated rank tracker, but it’s free and uses actual Google data rather than estimated CTR models.
| Tool | SOV Calculation Method | Best For | Limitation |
|---|---|---|---|
| Semrush Position Tracking | Estimated traffic ÷ total keyword volume | Keyword tagging and segmentation | Doesn’t distinguish SERP feature impact on CTR as granularly |
| Ahrefs Rank Tracker | Visibility % weighted by volume and CTR | Competitive side-by-side comparison | Limited to 10 competitors per project |
| Google Search Console | Actual impressions and clicks (manual analysis) | Budget-conscious teams wanting real Google data | No automated competitor comparison; requires manual work |
| Sistrix / SE Ranking / AWR | Visibility index or SOV metric (varies) | Regional or niche-specific tracking | Formulas not always transparent; cross-tool numbers don’t match |
A Word on Tool Selection
Don’t get stuck comparing tools for months. The tool matters far less than the discipline of tracking consistently. Pick whichever platform your team already uses, define your keyword set thoughtfully, add your real competitors, and start measuring. You’ll learn more from three months of consistent tracking than from switching tools twice trying to find the “perfect” setup.
How to Segment Share of Voice for Real Insight
A single share of voice number across all tracked keywords is useful for executive reporting. But it hides the details that drive strategy. Segmentation turns a vanity metric into an action plan.
By funnel stage. Break your keyword set into awareness, consideration, and decision-stage terms. A brand with 25% share of voice overall might have 35% on informational queries and 8% on commercial queries. That brand is educating the market but losing buyers to competitors at the moment of decision. The fix isn’t more blog posts, it’s better comparison pages, pricing content, and product-focused landing pages.
By topic cluster. Group keywords by the content themes they map to. If you sell project management software, you might have clusters around “task management,” “team collaboration,” “resource planning,” and “Gantt charts.” You might own 30% of the “task management” conversation and 3% of “resource planning.” That 3% tells you where to build content next.
By branded vs. non-branded. Your branded share of voice (people searching for your company by name) reflects brand awareness. Non-branded share of voice (people searching for your category) reflects how discoverable you are to people who don’t know you yet. Non-branded is almost always the harder number to grow, and the more valuable one to track.
At BrandMentions, we’ve seen B2B clients who looked healthy on overall share of voice but were losing ground fast on non-branded commercial terms. The overall number masked a strategic problem. Segmented tracking caught it early enough to fix. [EDITOR: INSERT, specific % shift or client example showing how segmented SOV revealed a hidden decline]
What “Good” Looks Like, Benchmarks and Targets
One of the biggest gaps in share of voice content across the web is this: nobody tells you what a good number actually is. Everyone explains the formula and then stops short of giving benchmarks. So here’s a practical framework.
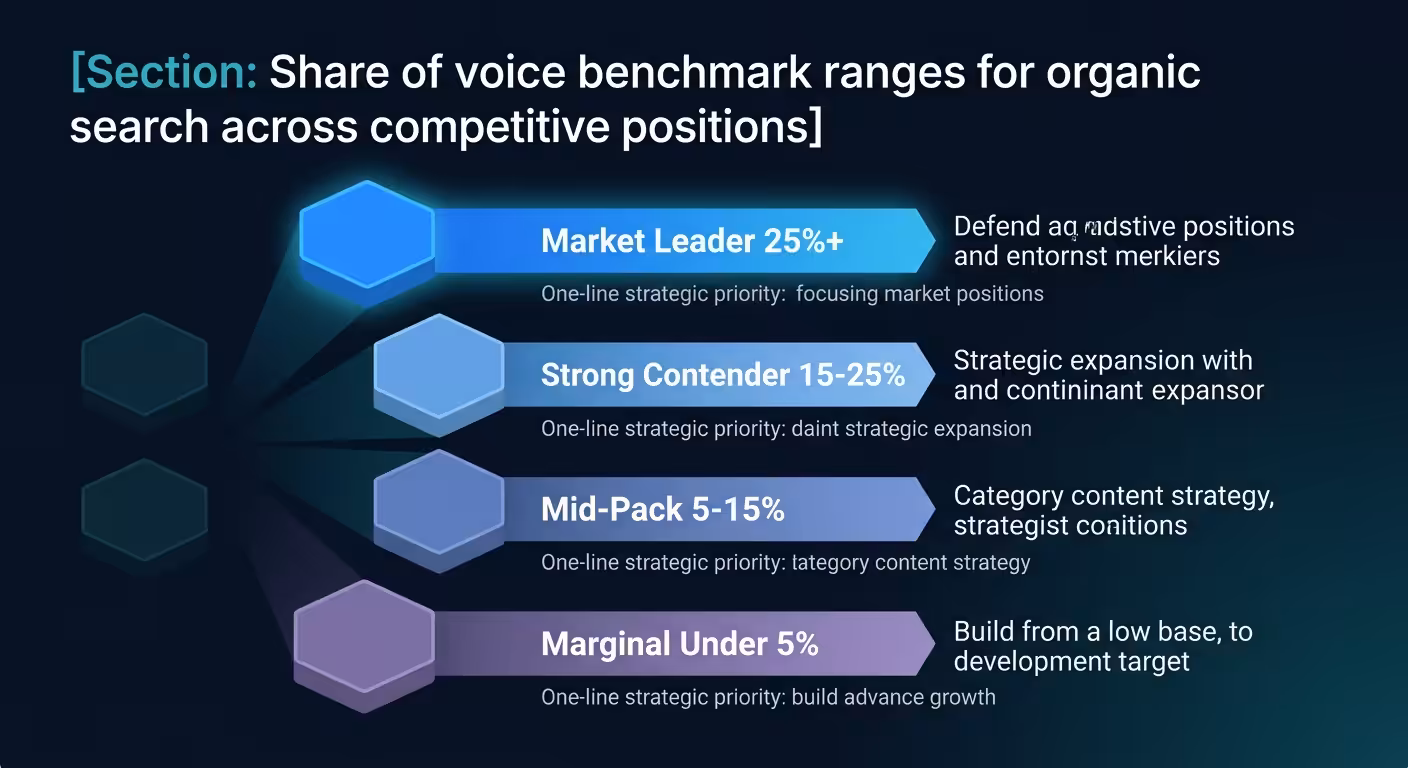
Market leader: 25%+ organic share of voice in your category keyword set. You’re the dominant presence. Competitors are fighting for what’s left. Your priority shifts to defending positions and expanding into adjacent keyword clusters.
Strong contender: 15-25%. You’re visible and competitive. A few strategic content investments in weak clusters can push you into market leader territory within 6-12 months.
Mid-pack: 5-15%. You have a presence, but you’re not top of mind in organic search. This is where most B2B brands land when they’ve invested in SEO but haven’t built a category-level content strategy.
Marginal: Under 5%. You’re barely visible in the organic landscape. Competitors own the conversation. The upside: small gains here produce disproportionate results because you’re starting from a low base.
These benchmarks shift by industry. In a fragmented market with dozens of competitors, 15% might make you the clear leader. In a duopoly, 30% might still mean you’re losing. The point isn’t to hit a universal number, it’s to know your number, know your main competitors’ numbers, and track the gap over time.
One pattern worth noting: share of voice tends to be stickier than individual rankings. A competitor can knock you off position #1 for a single keyword overnight. But shifting your overall share of voice by 5 points takes months of sustained effort. That’s actually good news, it means the investment compounds and isn’t easily erased by a single algorithm update.
Five Tactics That Actually Shift Organic Share of Voice
Growing share of voice in search isn’t about ranking for one more keyword. It’s about systematically expanding the territory you own across a category. Here are the tactics that move the number, not in theory, but in campaigns where we’ve measured the shift.
Build Topic Authority, Not Just Pages
Google rewards topical depth. A single blog post on “project management tips” won’t move your share of voice. A cluster of 15 interlinked pieces covering task management, resource allocation, sprint planning, Gantt alternatives, and team collaboration, that builds the topical authority that lifts all your rankings across the cluster.
Map your category to 5-8 core topic clusters. Audit what you’ve already published against each one. Identify the clusters where you have 1-2 pieces and competitors have 10. Those gaps are where new content generates the highest share of voice return.
Steal Competitor Visibility on High-Value Terms
Pull the keywords where your top 3 competitors rank in positions #1, 5 and you don’t rank at all. Filter by search volume. Sort by commercial intent. You now have a prioritized hit list of high-value terms where creating better content has immediate upside.
“Better” doesn’t mean longer. It means more specific, more current, more actionable, and more aligned with what the searcher actually needs. A 2,000-word guide that answers the query directly beats a 5,000-word piece that buries the answer under an introduction about the history of the concept.
We’ve run this exercise for clients who thought they had strong organic coverage. The competitor gap analysis almost always surfaces 20-40 high-volume keywords that represent immediate share of voice opportunity. [EDITOR: INSERT, client example or typical % lift from targeting competitor gap keywords]
Refresh Decaying Content Before It Tanks
Content decay is one of the biggest silent drains on share of voice. A page that ranked #3 eighteen months ago might have drifted to #9 without anyone noticing. That single drop across twenty decaying pages erodes your share of voice more than most teams realize.
Quarterly content audits aren’t optional. Pull your pages that dropped 3+ positions in the last 6 months. Update stats, refresh examples, improve internal linking, add sections that address new related queries from People Also Ask, and republish. This is often the fastest way to reclaim lost share of voice because you’re recovering existing equity rather than building from scratch.
Win SERP Features, They Eat Organic Clicks
Featured snippets, People Also Ask, and other SERP features consume clicks that would otherwise go to standard organic results. If a competitor holds the featured snippet on a keyword where you rank #2, your actual click share is much lower than your position suggests. Your share of voice metric might not capture this unless your tool accounts for SERP features (Ahrefs does; not all tools do).
Target featured snippets deliberately. Structure your content with direct-answer paragraphs under question headings. Use numbered lists for process queries. Use tables for comparison queries. These aren’t just formatting choices, they’re competitive moves that shift organic visibility in your favor.
Build Entity Signals Beyond Your Own Site
Search engines associate brands with topics based on signals across the web, not just on your site. When your brand is mentioned on relevant, authoritative publications in your category, with or without a link, it strengthens the entity signal that connects your brand to the topics you want to rank for.
This is where brand mentions and organic SEO intersect. A brand that’s cited across industry publications, expert roundups, and editorial reviews builds the kind of entity authority that helps every page on the site rank better. It’s a compound effect: more off-site brand signals to stronger entity authority to higher rankings across more keywords to higher share of voice.
One insight from our work at BrandMentions: clients who invest in building strategic mentions on category-relevant publications see their non-branded organic share of voice improve within 3-5 months, even on keywords they haven’t directly optimized for. The entity signal does the heavy lifting. [EDITOR: INSERT, specific SOV improvement range or client data point]
Tracking Frequency and Reporting That Gets Attention
Monthly tracking is the minimum. Weekly tracking is better if your market moves fast or you’re in the middle of a major content push. Daily tracking creates noise, share of voice doesn’t change meaningfully day to day, and daily fluctuations lead to reactive decisions.
For reporting, focus on three things:
The trend line over 6+ months. A single month’s number is a data point. Six months of data is a trend. Show the trajectory. Is your share of voice growing, flat, or declining? That story is more valuable than any single number.
Competitive position changes. Don’t just report your own share of voice. Show how you stack up against your top 3-5 competitors. If you grew from 12% to 14%, that’s good. If you grew from 12% to 14% while your main competitor dropped from 22% to 18%, that’s a different strategic picture entirely.
Segment-level shifts. Report overall share of voice for the executive summary. Then break out the segments, funnel stage, topic cluster, branded vs. non-branded. The segment data is where the actionable insights live.
A tip for getting buy-in from leadership: connect share of voice to revenue proxies. If your organic share of voice is 12% in a category where total search-driven revenue is estimated at $50M, you can frame your organic visibility as being worth approximately $6M in addressable revenue. That framing makes the metric tangible for people who don’t think in SEO terms. (Yes, it’s a simplification. It still works for getting budget.)
Mistakes That Quietly Kill Your Share of Voice
Some of the most damaging mistakes aren’t dramatic. They’re the slow leaks that drain share of voice over quarters while the team focuses on other metrics.
Tracking only branded keywords. If most of your keyword set is brand-name searches, your share of voice will look artificially high. You’re measuring awareness, not category competitiveness. Always include, and separately track, non-branded category terms.
Ignoring keyword cannibalization. When multiple pages on your site compete for the same keyword, Google splits signals between them. Neither page ranks as well as a single consolidated page would. This is surprisingly common in companies that publish frequently. Audit for cannibalization and consolidate or differentiate competing pages.
Chasing volume without intent. Adding high-volume informational keywords to your tracking set inflates the denominator without moving revenue. A keyword like “what is project management” has massive volume but rarely converts. If it’s diluting your share of voice picture, either segment it out or weight your reporting toward commercial terms.
Measuring share of voice without acting on it. The most common failure isn’t methodological, it’s behavioral. Teams set up tracking, review the dashboard once, and then go back to their keyword-by-keyword workflows. Share of voice is useful only if it changes how you allocate content resources. Otherwise it’s just a more sophisticated way to feel informed while doing nothing different.
Share of Voice in Search vs. Other Channels
Search share of voice is one piece of the visibility picture. Teams often measure it alongside social share of voice, paid search impression share, and earned media share of voice. These are related but measure fundamentally different things.
Search share of voice measures organic visibility across a defined keyword set. Social share of voice measures brand conversation volume relative to competitors. Paid search impression share measures how often your ads appear for targeted keywords. Earned media share of voice measures press coverage and third-party mentions. Each reflects a different dimension of brand presence.
The mistake is treating these as interchangeable. A brand with high social share of voice and low search share of voice is generating conversations but not capturing demand when people actively search for solutions. A brand with high search share of voice and low social presence is capturing demand but not building the kind of awareness that feeds future search volume.
The most useful view is all channels together. But if you’re forced to pick one metric to focus on first, organic search share of voice has the strongest link to revenue for most B2B brands, because it measures visibility at the moment of active intent. People are searching for a solution. Are they finding you?
For a broader framework on measuring across channels, the share of voice overview covers how to think about SOV across paid, earned, owned, and organic surfaces. And if you’re specifically tracking how share of voice connects to market share, that relationship becomes the foundation for long-term growth planning.
Beyond Organic Rankings: The AI Search Layer
Search share of voice traditionally means organic keyword visibility, but AI-generated answers (ChatGPT, Perplexity, Google AI Overviews) are now a parallel search surface with their own share-of-voice dynamic — one driven heavily by brand mention volume across the web, not just keyword rankings. A brand can own strong organic search SOV and still be absent from the AI answers increasingly replacing that first search click.
Frequently Asked Questions
What is share of voice in search?
Share of voice in search is the percentage of total organic visibility your brand captures across a defined set of keywords compared to competitors. It’s calculated by dividing your estimated organic traffic from tracked keywords by the total estimated organic traffic available from those keywords, then multiplying by 100. It gives you a single number that represents how much of the search landscape you own in your category.
How is search share of voice different from keyword rankings?
Keyword rankings tell you your position on individual terms. Share of voice weights those positions by search volume and expected click-through rate, producing a single metric that reflects your total visibility across an entire keyword set. You can rank well on low-volume terms and still have a weak share of voice if competitors dominate the high-volume queries.
How often should I measure share of voice in search?
Monthly is the minimum for meaningful trend analysis. Weekly tracking works well during active content campaigns or competitive shifts. Daily tracking creates noise, share of voice doesn’t fluctuate meaningfully day to day. The real value comes from tracking the trend over 6+ months, not reacting to short-term changes.
Can I measure search share of voice for free?
Yes, roughly. Google Search Console provides actual impression and click data for your site. By filtering for category-relevant keywords and comparing your click share against total impressions, you can approximate your organic share of voice. It’s less automated than paid tools like Semrush or Ahrefs, but it uses real Google data and costs nothing.
What’s a good share of voice in organic search?
It depends on your market. In fragmented markets with many competitors, 15% can make you the leader. In concentrated markets, you might need 30%+. The most useful benchmark isn’t an absolute number, it’s your share relative to your main competitors and whether it’s trending up or down over time. A 10% share of voice that’s grown from 5% in six months signals stronger momentum than a static 20%.
Your Share of Voice Number Is Waiting
Here’s the move: pick one tool, build a keyword set of 50-100 category terms (not just the ones you rank for), add your top 5 competitors, and check your share of voice right now. That number is your baseline. It’ll probably be lower than you expect, and that’s the point. You can’t grow what you haven’t measured.
For a deeper look at how to measure share of voice across every channel, not just search, start there next. The framework scales.