
How to Measure Share of Voice Across Every Channel
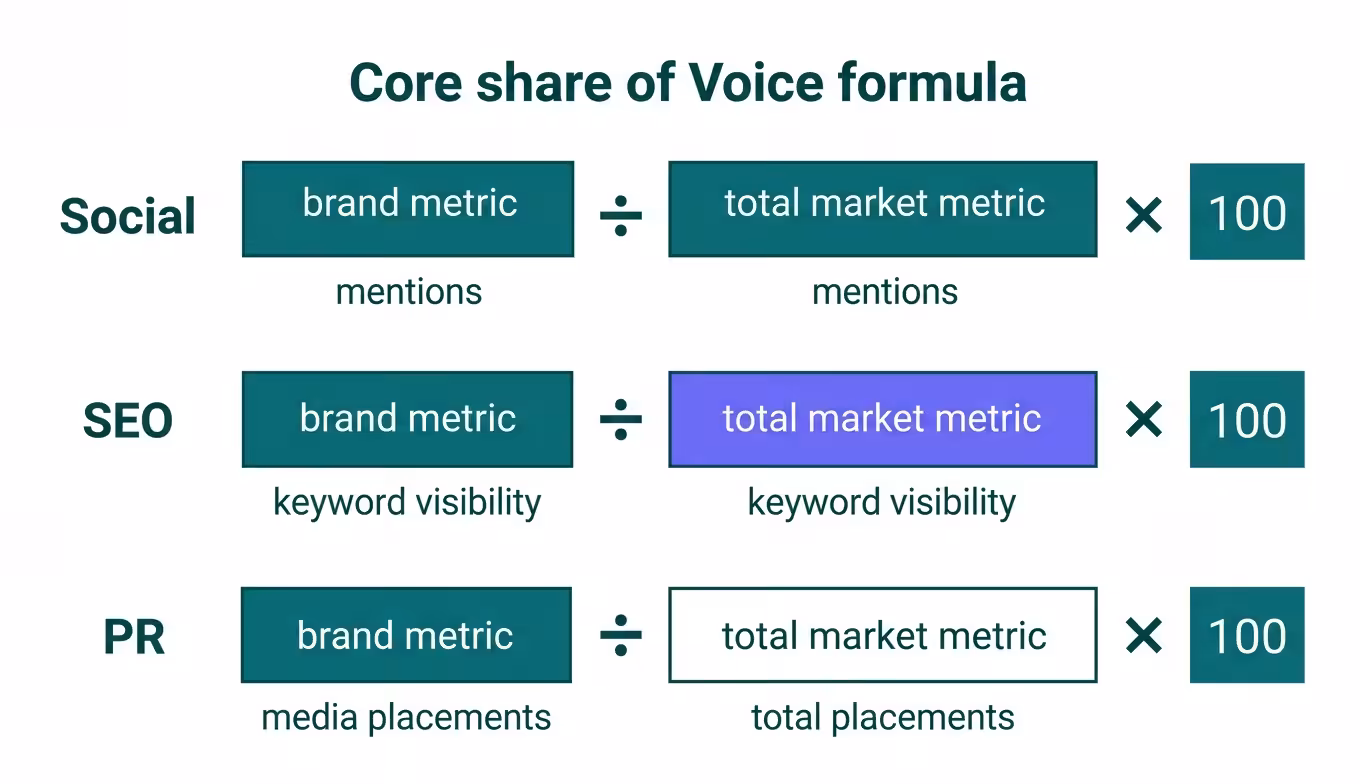
Share of voice tells you how much of the conversation in your market belongs to your brand versus your competitors. To measure it, divide your brand’s metric (mentions, impressions, ad spend, or keyword visibility) by the total market metric across all tracked competitors, then multiply by 100. That gives you a percentage, your share of the category’s total visibility on any given channel.
The formula hasn’t changed much in decades. What has changed is where you need to apply it. In 2026, share of voice isn’t just a media buying metric or a social listening stat. It extends to organic search, AI-generated answers, influencer content, and LLM citations. Brands that only track one channel get a distorted picture, and distorted pictures lead to bad budget decisions.
This guide breaks down the exact methods for measuring share of voice on every channel that matters right now, including the ones most guides still ignore.
What You’ll Learn
- The core share of voice formula and how to adapt it per channel
- Channel-specific measurement methods for social, SEO, PPC, PR, and AI search
- How to choose the right competitive set and time window
- Where most brands get SOV measurement wrong, and how to fix it
- Tools that actually work for each channel in 2026
The Share of Voice Formula (And Why One Formula Isn’t Enough)
Share of voice equals your brand’s measured presence divided by the total measured presence across all competitors, multiplied by 100. The result is a percentage that shows your slice of the category conversation.
Written out:
SOV (%) = (Your Brand’s Metric ÷ Total Market Metric) × 100
If your brand earned 3,200 social mentions last month and all tracked competitors combined (including you) earned 28,000 mentions, your social share of voice is 11.4%.
Simple enough. But here’s where most measurement falls apart: the formula changes meaning depending on which metric you feed into it. Social mentions, organic keyword visibility, paid impression share, and media coverage volume all use the same math, yet they measure fundamentally different things. Lumping them together into a single “SOV number” creates the illusion of insight without the substance.
Treat each channel as its own measurement. Then look at the pattern across channels to spot where you’re strong, where you’re weak, and where your competitors are eating your visibility.
How to Measure Social Media Share of Voice
Social SOV measures how much of the public conversation about your category features your brand. It’s the most accessible form of share of voice because the data is abundant and tools have matured to handle it well.
What to measure: brand mentions (tagged and untagged), branded hashtag usage, @mentions, and comment volume where your brand is the topic. Some teams also include share of engagement, likes, shares, and comments on brand content versus competitor content, though this tells you more about content quality than visibility.
Step-by-step method:
- Define your competitive set. Pick 4-6 direct competitors. More than that dilutes the signal.
- Choose a consistent time window. Monthly is standard. Weekly if you’re running a campaign and need faster feedback.
- Track mentions across platforms, X, LinkedIn, Instagram, TikTok, Reddit, and relevant forums. Don’t limit to one platform unless your audience genuinely lives there exclusively.
- Sum total mentions for all brands in your set (including yours).
- Divide your mentions by the total. Multiply by 100.
What most brands miss: untagged mentions. Someone writing “just switched from Salesforce to HubSpot” on LinkedIn doesn’t tag either brand. Social listening tools like Brandwatch and Sprout Social catch these. Google Alerts won’t. If you’re only tracking @mentions and hashtags, you’re undercounting by 30-50% in most B2B categories.
Also worth noting, a high mention count with predominantly negative sentiment isn’t a win. Pair social SOV with measuring brand sentiment to understand whether your share of conversation is actually working for you.
How to Measure SEO Share of Voice
SEO share of voice quantifies your organic search visibility relative to competitors across a defined set of keywords. It’s one of the strongest leading indicators of organic traffic potential because it captures both ranking position and search volume in a single metric.
SEO share of voice is calculated by estimating the organic click-through rate for each keyword you rank for, multiplied by that keyword’s monthly search volume, then dividing your total estimated clicks by the total estimated clicks available across all tracked keywords and competitors.
Most SEO professionals don’t calculate this manually. Tools like Ahrefs, Semrush, and Sistrix calculate SEO visibility scores that function as SOV proxies. Ahrefs calls theirs “Share of Voice” directly, it estimates organic traffic share across a keyword list you define.
The method that actually works:
- Build a keyword list that represents your category. Not just your keywords, the full set of terms a buyer might search when considering a solution in your space. Include branded and unbranded terms.
- Add your competitors to the same tracking project.
- Let the tool calculate visibility share based on ranking positions and estimated CTR curves.
- Review monthly. Look for trends, not snapshots.
The keyword list is where this measurement lives or dies. Track too few keywords and a single ranking change swings your SOV by 10 points. Track too many generic terms and you dilute the metric with keywords your buyers don’t actually search. For a B2B SaaS company, 80-150 high-intent keywords usually gives a stable, meaningful picture.
One blind spot in pure SEO SOV: it doesn’t account for SERP feature ownership. If a competitor holds the Featured Snippet for your most valuable keyword, their actual visibility is much higher than their organic ranking position suggests. Factor SERP feature presence into your analysis whenever possible.
How to Measure PPC Share of Voice
Google Ads already does most of this work for you. Your impression share, the percentage of available impressions your ads captured, is effectively your paid share of voice for a given keyword set.
Find it in Google Ads under Campaigns to Columns to Competitive Metrics to Search Impression Share. You’ll also see “Search Lost IS (Budget)” and “Search Lost IS (Rank),” which tell you whether you’re losing visibility because of spend limits or ad quality.
For a broader PPC SOV that includes competitors, tools like SpyFu and Auction Insights (built into Google Ads) reveal how often you and specific competitors show for the same queries, and how your overlap, position, and outranking rates compare.
PPC share of voice is the easiest to manipulate, you can buy more of it tomorrow by increasing your budget. That’s also why it’s the least durable form of SOV. The moment you stop spending, it drops to zero. Think of it as a visibility accelerator, not a foundation.
How to Measure PR and Media Share of Voice
Media SOV measures how much press coverage your brand earns compared to competitors. This was the original share of voice metric, born in advertising, refined in PR, and it still matters for brands that invest in earned media.
What counts: news articles, industry publications, podcast mentions, analyst coverage, and broadcast segments. Depending on your category, you might also include conference presentations and guest columns.
The challenge here is data collection. Social mentions are relatively easy to scrape. Media coverage requires either a media monitoring service (Meltwater, Cision, or Muck Rack) or a manual tracking process.
A practical approach for teams without enterprise tools:
- Set up Google News Alerts for your brand and each competitor.
- Log every piece of coverage in a shared spreadsheet: date, publication, brand mentioned, article topic.
- At month’s end, count coverage per brand and calculate share.
Crude? Yes. But it catches the broad strokes. When you’re ready for deeper analysis, media monitoring platforms can layer in reach estimates, publication authority scores, and sentiment, all of which add nuance to a raw mention count.
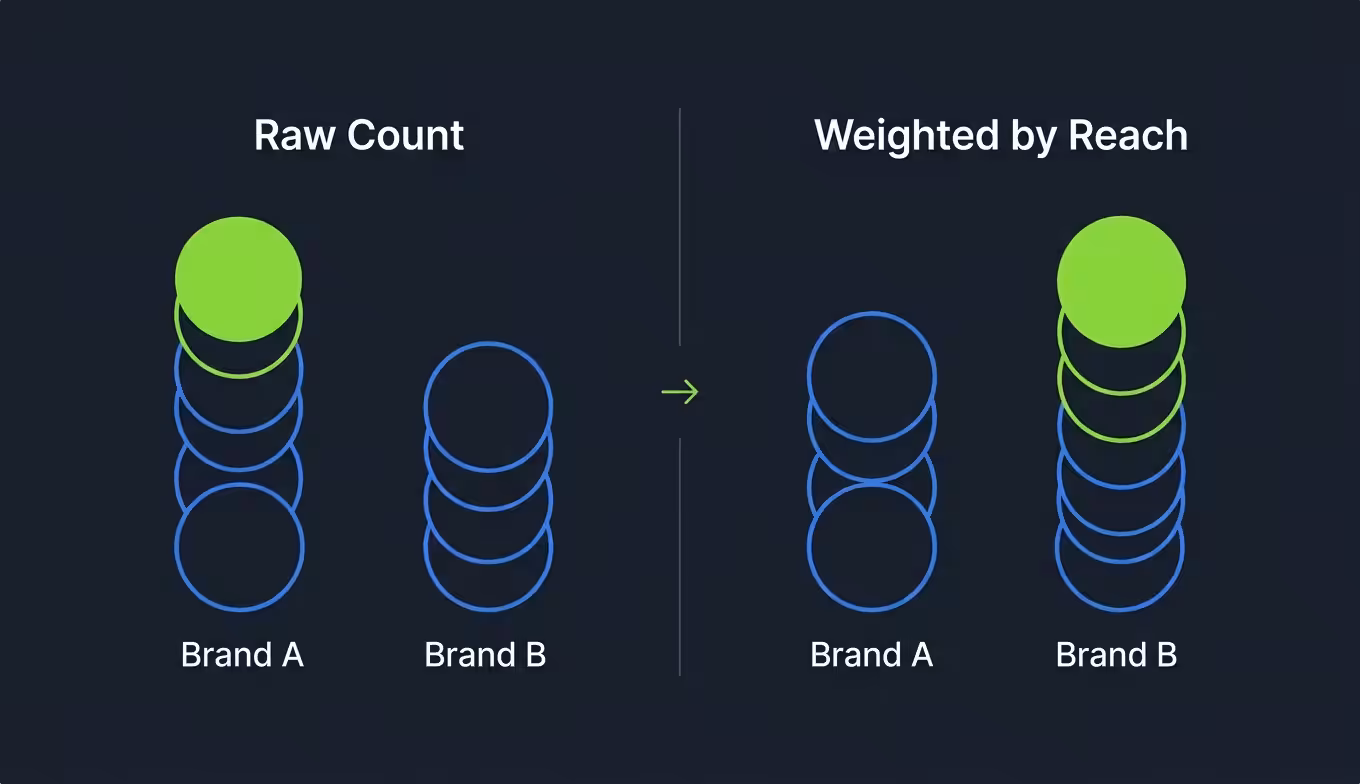
One opinion I’ll stand behind: raw coverage count is an almost useless metric on its own. A mention in the Wall Street Journal and a mention in a regional blog with 200 monthly visitors aren’t equivalent. If you’re measuring media SOV, weight by publication reach or domain authority. Otherwise, you’re optimizing for volume instead of impact.
How to Measure Share of Voice in AI Search
For the per-platform walkthroughs behind the AI-search slice of SOV, see the ChatGPT brand mention check workflow and Perplexity brand monitoring, and how AI models cite brands covers the cross-platform cadence the AI-side measurement described below should run on.
This is the channel most guides still skip entirely. And it’s the one growing fastest.
When a buyer asks ChatGPT, Perplexity, or Gemini for a recommendation in your category, the brands that get mentioned in the response have share of voice in AI search. The brands that don’t get mentioned have zero, regardless of how strong their Google rankings are.
Measuring AI share of voice is harder than any traditional channel because AI responses aren’t indexed, aren’t static, and change based on how the question is phrased. But it’s not impossible.
Method 1: Manual prompt auditing. Build a list of 20-30 category-relevant prompts your buyers might ask an AI assistant. (“What’s the best project management tool for remote teams?” / “Compare Notion and Monday.com for enterprise use.”) Run each prompt across ChatGPT, Perplexity, and Gemini. Log which brands appear in each response. Calculate your mention frequency versus competitors.
Method 2: AI visibility tracking tools. A growing category of tools now automates this process. They run prompt libraries at regular intervals and track which brands get cited in AI-generated answers over time. The pattern we see in AI citation audits is that brands appearing in category-relevant editorial content are materially more likely to be recommended in LLM responses than brands leaning on their own website content alone.
AI share of voice matters because it shapes first impressions before a buyer ever reaches your website. If ChatGPT recommends three competitors and doesn’t mention you, you’re not even in the consideration set, and you may never know it happened.
Choosing Your Competitive Set and Time Window
Your SOV measurement is only as useful as your inputs. Pick the wrong competitors or the wrong timeframe and the number means nothing.
Competitive set: 4-6 direct competitors is the sweet spot. Fewer than 4 and a single competitor’s spike distorts your share. More than 8 and the metric gets diluted, everyone has a small slice and movement is hard to spot. Include the brands your sales team actually loses deals to, not every company in your general industry.
Resist the urge to include aspirational competitors you don’t actually compete with for buyers. If you’re a Series B SaaS company, measuring your SOV against Salesforce tells you nothing actionable. Measure against the 5 companies your prospects are comparing you to on G2 and in demo calls.
Time window: Monthly measurement gives stable trends. Weekly is useful during campaigns or product launches. Quarterly is too slow, by the time you see a drop, you’ve already lost ground for three months.
Compare the same time period year-over-year, not just month-over-month. SOV in many categories is seasonal. A dip in December might be completely normal for your industry.
Where Most SOV Measurement Goes Wrong
The SOV mistake we see most often in competitive audits is a team benchmarking against the wrong peer set: loud incumbents that show up for brand queries that nobody is actually evaluating against them. The category-defining comparison is usually the two or three companies a prospect names in the sales call, not the three biggest logos in the industry. Re-run the math against that narrower set and the headline number almost always changes.
After reviewing how dozens of marketing teams track share of voice, a few mistakes come up over and over.
Mistake 1: Treating all mentions as equal. A mention on TechCrunch and a mention in a spam blog aren’t the same thing. If your measurement doesn’t weight for source quality, reach, or sentiment, a competitor could be “winning” SOV with coverage that actively hurts their brand. Quality weighting isn’t optional, it’s the difference between a vanity metric and a useful one.
Mistake 2: Measuring one channel and calling it SOV. Social listening tools make it easy to track social SOV, so teams stop there. But your buyers don’t live on one channel. A full media monitoring report covers social, search, media, and increasingly, AI surfaces. Cross-channel measurement reveals where competitors are investing, and where they’re leaving gaps for you.
Mistake 3: No competitive context. Your SOV dropped from 18% to 14%. Is that bad? It depends. Did the total conversation shrink (your absolute mentions may be unchanged)? Did a new competitor enter the market and take share from everyone? Without context, a number is just a number.
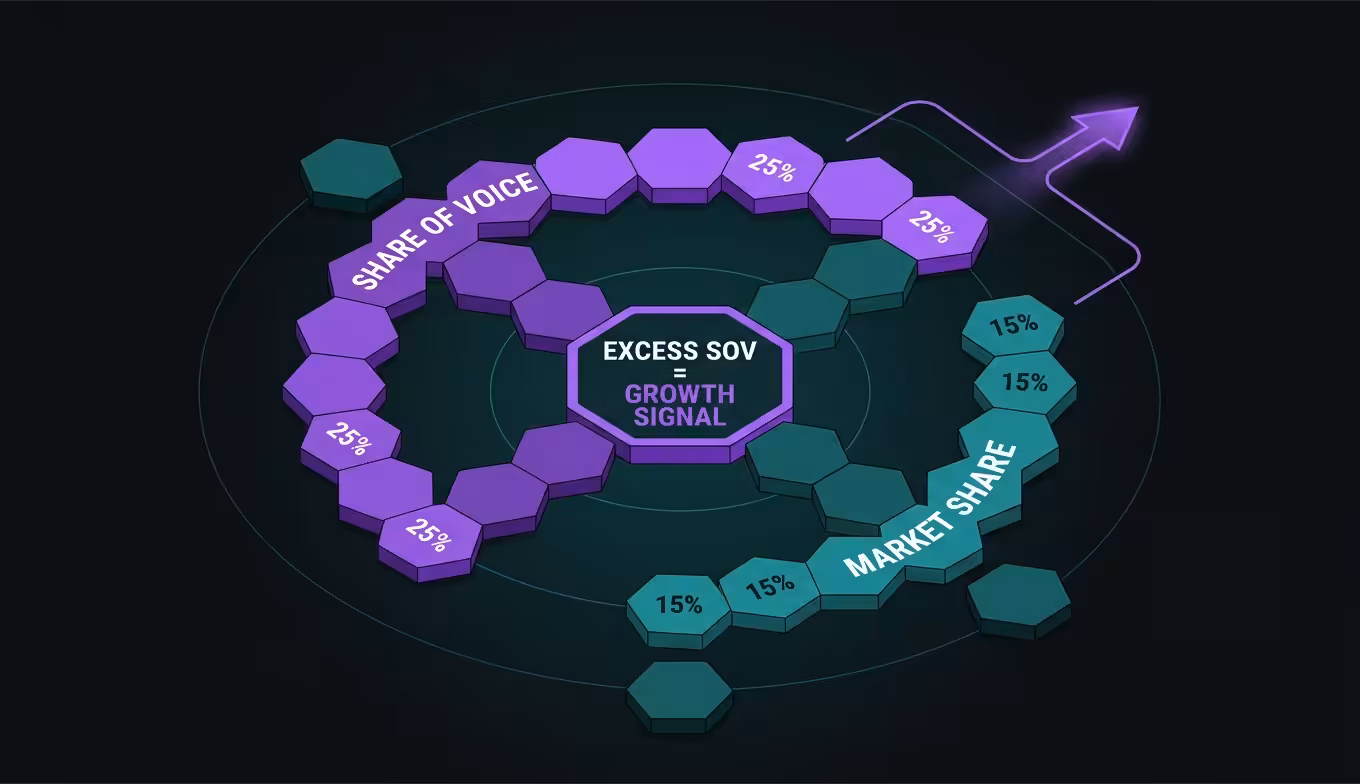
Mistake 4: Ignoring the gap between SOV and market share. Research by Les Binet and Peter Field across 171 campaigns found that brands with an excess share of voice (SOV exceeding their market share) tend to grow, while brands with a deficit tend to shrink. That gap, not the absolute SOV number, is the metric that predicts growth.
Which Tools to Use for Each Channel
You don’t need one tool that does everything. You need the right tool for each channel you’re measuring.
| Channel | Recommended Tools | What They Measure |
|---|---|---|
| Social media | Brandwatch, Sprout Social, Hootsuite | Mentions, hashtags, engagement share, sentiment |
| SEO / organic search | Ahrefs, Semrush, Sistrix | Keyword visibility, estimated traffic share, SERP feature ownership |
| PPC / paid search | Google Ads (Auction Insights), SpyFu | Impression share, overlap rate, outranking share |
| PR / media | Meltwater, Cision, Muck Rack, Google News Alerts | Coverage volume, publication reach, sentiment, message pull-through |
| AI search | AI visibility analytics platforms, manual prompt auditing | Brand citation frequency in LLM responses, recommendation position |
Budget-conscious teams can start with Google Ads impression share (free within your Google Ads account), Google News Alerts (free), and manual AI prompt auditing (free but time-intensive). Layer in paid tools as your measurement practice matures.
Building a Share of Voice Report That Drives Decisions
A SOV dashboard that sits in a spreadsheet and gets glanced at once a month doesn’t change behavior. The report needs to answer three questions every time someone opens it:
- Where are we gaining? Which channels saw SOV increase? What drove it, your activity or a competitor going quiet?
- Where are we losing? Which channels showed decline? Is a specific competitor taking share, or is the total conversation growing while your absolute presence stays flat?
- What should we do next? Tie every SOV movement to a recommended action. SOV down on social? Audit content cadence and topic relevance. SOV down in AI search? Review where your brand appears in editorial sources LLMs pull from.
Include a month-over-month trend line for each channel, a competitor comparison table, and a “biggest movers” callout that highlights the most significant shifts. Keep it to one page. Executives won’t read more than that, and they shouldn’t have to.
After You’ve Measured: Closing the Gap
A measurement framework tells you your current share — it doesn’t grow it. Once you have a baseline across the channels above, the fastest lever to move the number is earning more mentions in the sources feeding that measurement, particularly press and AI-generated answers where mention volume compounds over time. Measurement without a mention-building plan behind it just produces a number that stays flat.
Frequently Asked Questions
What is a good share of voice percentage?
There’s no universal benchmark, it depends entirely on your market concentration and competitive set. In a fragmented category with 20+ competitors, 8-12% might be strong. In a category with 4 dominant players, anything below 20% could signal you’re underweight. The more useful question: is your SOV higher than your current market share? If yes, you’re positioned for growth.
How often should you measure share of voice?
Monthly is the standard cadence for most brands. It’s frequent enough to catch shifts early but long enough to smooth out daily noise. During active campaigns or product launches, switch to weekly. Quarterly is too slow, competitive dynamics move faster than that in most categories.
Can you measure share of voice without paid tools?
Yes, but with limitations. Google Ads impression share is free within your account. Google News Alerts gives you basic media coverage tracking. For social, you can manually search brand mentions on each platform. AI search SOV can be measured by running prompts yourself. It’s labor-intensive, but a startup with zero budget can still get a directional picture of where they stand. Paid tools add speed, accuracy, and historical trending, they’re worth it once measurement becomes a regular practice.
What’s the difference between share of voice and share of market?
Share of voice measures visibility, how much of the conversation or advertising space your brand occupies. Share of market measures revenue, how much of total category sales you capture. SOV is a leading indicator. Market share is a lagging one. Think of it this way: imagine a brand that suddenly doubles its media presence but hasn’t changed its sales numbers yet. Its SOV has jumped while its market share stays flat. If the pattern holds, market share growth typically follows within 6-12 months.
Does share of voice in AI search actually matter?
It matters more every quarter. When a buyer asks ChatGPT or Perplexity to recommend a solution in your category, the brands that appear in the answer are the ones that enter the consideration set. If your competitors are consistently cited and you’re not, you’re losing deals before they even become deals, at a stage you can’t track in your CRM. Measuring and building brand visibility in AI search is becoming as important as measuring organic search visibility.
Using Share-of-Voice Data to Drive the Next Quarter’s Plan
Measuring share of voice is step one. The real value comes from what you do with the data, and most teams stop too early. They measure, they report, and then the number sits in a slide deck until next month.
Tie every SOV insight to a specific action. If your social SOV dropped because a competitor launched a viral campaign, don’t just note it, decide whether to respond with your own content push or invest in a different channel where they’re weaker. If your AI search SOV is near zero while competitors are getting cited regularly, that’s a signal to invest in the editorial presence that LLMs actually learn from.
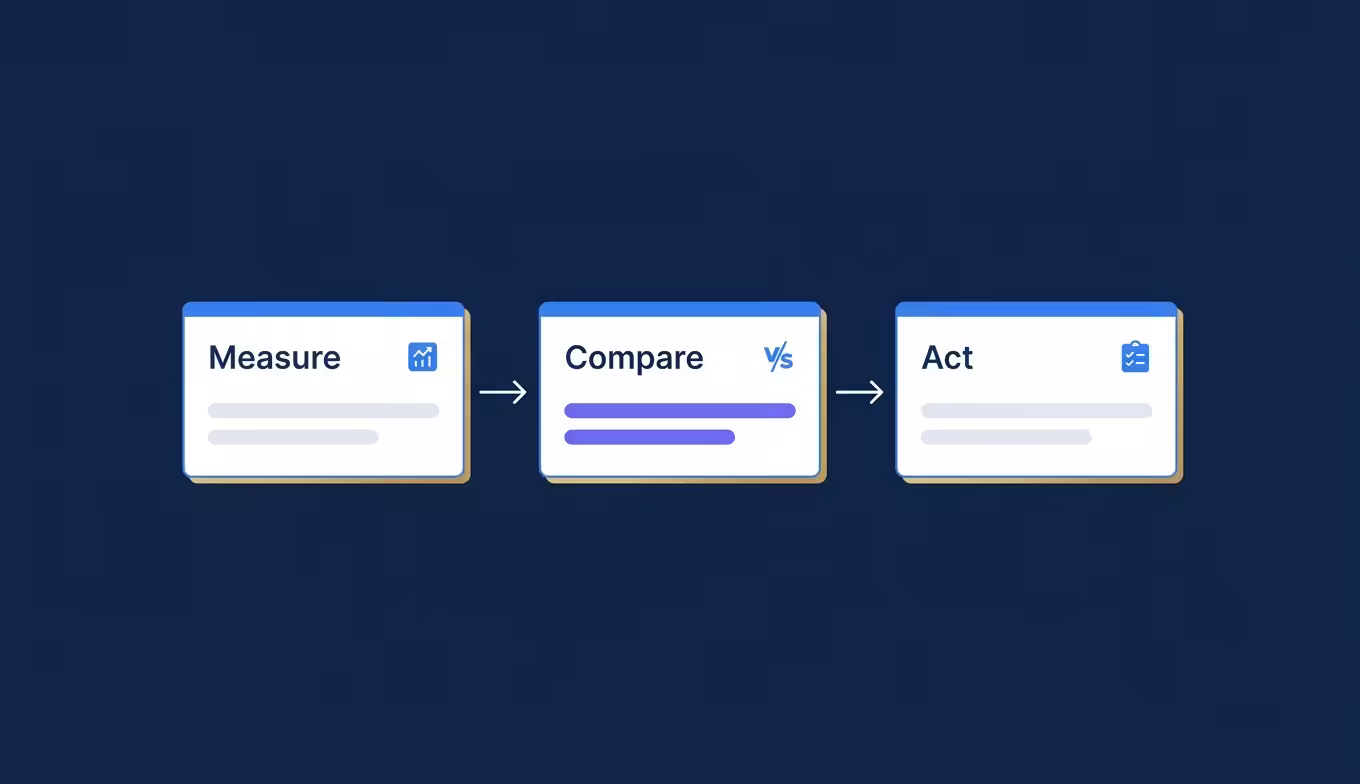
The brands that grow their share of voice consistently are the ones that treat it as an operational metric, not a reporting metric. Measure it. Compare it. Act on it. Repeat monthly.
If you want a baseline before committing to a tool or process, request a quick AI visibility audit. We’ll run 25 category-relevant prompts across ChatGPT, Perplexity, Gemini, and Google AI Overviews so you can see exactly which sources each platform trusts for your category, and which competitors are capturing citations you’re not.
Written by the BrandMentions editorial team. AI-assisted draft, human-edited and reviewed for accuracy.
Frequently Asked Questions
How do I measure share of voice across multiple regions or countries?
Regional share of voice measurement requires either a multi-country brand monitoring tool (Brand24, Brandwatch, Talkwalker support 30+ regions) or running separate tracked queries per region with a tool that filters by geography. The formula stays the same: your mentions divided by total category mentions in that region, expressed as a percentage. The tricky part is normalizing for population and search volume differences. A 10 percent share of voice in Brazil and 10 percent in Germany don’t represent equal opportunity. Adjust for category search volume per region before comparing.
[
,
]