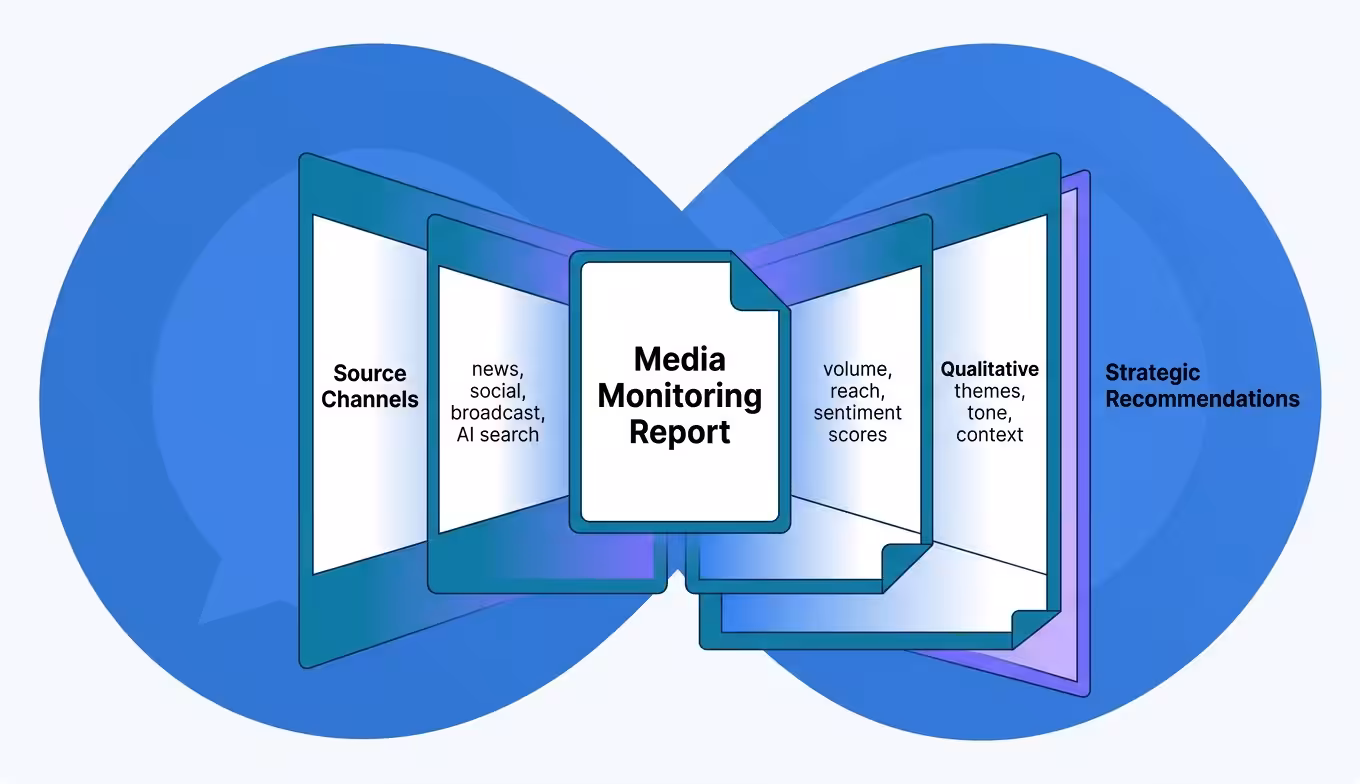
A media monitoring report is a structured document that collects, organizes, and analyzes every mention of your brand, competitors, or industry topics across news, social media, broadcast, and digital channels, then translates that raw data into decisions your team can act on. Most reports fail not because the data is missing, but because nobody connects the numbers to what the business should do next. The difference between a report that gets skimmed and one that reshapes your next quarter’s strategy comes down to structure, metric selection, and how clearly you tie coverage patterns to business outcomes.
If you’ve ever sent a spreadsheet of clippings to your leadership team and watched it disappear into their inbox, this is the fix. A strong media monitoring report doesn’t just prove you’re being talked about, it shows where the conversation is heading, who’s driving it, and what your team should do about it.
What You’ll Learn
- What belongs in a media monitoring report (and what to leave out)
- The metrics that actually influence decisions, not just decorate slides
- How to structure reports for different stakeholders, from PR teams to the C-suite
- Where AI-powered media coverage fits into monitoring in 2026
- A step-by-step process for building your first report from scratch
What a Media Monitoring Report Actually Covers
A media monitoring report tracks how your brand appears across every channel where public conversation happens: online news outlets, print publications, broadcast TV and radio, podcasts, social media platforms, forums, and, increasingly, AI-generated search responses. The report aggregates these mentions into quantitative metrics and qualitative analysis so teams can measure reputation, benchmark against competitors, and spot emerging risks before they escalate.
But here’s what separates a useful report from a vanity document: scope discipline. Monitoring everything sounds thorough. In practice, it creates noise that buries the signals your team needs. The best reports define their boundaries upfront, which brands, which keywords, which channels, which time window, and hold those boundaries tight.
Think of it as a radar screen. You’re not tracking every aircraft in the sky. You’re watching the ones heading toward your airspace.
Why Most Media Monitoring Reports Get Ignored
The uncomfortable truth: most monitoring reports are data dumps with a logo on them. They list every mention, tally some numbers, and land in inboxes where they die quietly. The problem isn’t the data, it’s the absence of interpretation.
A report that says “You received 1,247 mentions this month, up 12% from last month” tells the reader almost nothing. Up 12% because of a product launch? A crisis? A viral meme? Without context, the number is decoration.
Three patterns show up repeatedly in reports that fail to influence decisions:
1. No Audience Awareness
A report for the CEO should look nothing like a report for the social media manager. Same data, different framing, different depth. When everyone gets the same document, nobody gets what they need.
2. Metrics Without Benchmarks
Raw numbers don’t mean much without a reference point. Is 1,247 mentions good? Compared to what, last quarter, your top competitor, your industry average? Benchmarks turn numbers into judgments.
3. No “So What” Section
Data without recommendations is homework the reader didn’t ask for. Every section of a monitoring report should end with an implication, what this means and what to do about it.
If your report reads like a receipt, it’ll be treated like one. Filed and forgotten.
Metrics That Belong in Every Report
Not all metrics deserve a spot. The ones that earn their place connect directly to a business question someone on your team is trying to answer. Here’s what holds up under scrutiny.
Mention Volume and Trend Direction
Total mentions over the reporting period, broken down by channel. But the raw count matters less than the trend line, is volume growing, shrinking, or spiking in response to specific events? Map mention volume against your campaign calendar and news cycle. The correlation tells the story.
Sentiment Distribution
Sentiment analysis classifies mentions as positive, negative, or neutral based on the language surrounding your brand name. In 2026, most monitoring platforms use natural language processing to automate this, though accuracy still varies, especially with sarcasm, industry jargon, and non-English content. Report the distribution, but always spot-check the classifications manually before presenting to stakeholders.
A ratio shift matters more than absolute numbers. If negative sentiment jumped from 8% to 19% of total mentions in two weeks, that’s a signal, even if the total volume of negative mentions is small.
Share of Voice
Share of voice measures what percentage of the total conversation in your category belongs to your brand versus competitors. It’s one of the few media metrics that directly correlates with market share over time. A strong share of voice measurement gives leadership a competitive context that raw mention counts can’t provide.
Reach and Estimated Impressions
Reach estimates how many people could have seen a mention based on the publication’s audience size. It’s imperfect, reach doesn’t equal readership, but it distinguishes a mention in a niche blog from one in The Wall Street Journal. Include it, but don’t overweight it. A high-reach mention with negative sentiment isn’t a win.
Source Quality and Channel Breakdown
Where are mentions appearing? Tier 1 national outlets, trade publications, social platforms, podcasts, forums? The channel mix reveals whether your media presence is broad or concentrated, and whether it’s reaching the audiences that actually influence buying decisions.
Key Message Pull-Through
This one gets overlooked. Of all your coverage, how much actually includes the messages you’re trying to land? If your PR team pitched a story about your new enterprise product and the resulting coverage focused on your CEO’s personal background instead, volume looks fine but message pull-through is zero. Track the difference.
How to Structure a Report for Different Stakeholders
A single report format for every audience is a shortcut that costs you influence. The data is the same, the framing changes.
| Audience | What They Need | Report Focus | Ideal Length |
|---|---|---|---|
| C-Suite / Board | Business impact, risk, competitive position | Executive summary, share of voice, sentiment trend, 2-3 recommendations | 1-2 pages |
| VP of Marketing | Campaign performance, channel effectiveness, competitor comparison | Mention volume by campaign, channel breakdown, message pull-through, SOV | 3-5 pages |
| PR / Comms Team | Tactical detail, journalist relationships, coverage quality | Full mention list, source-by-source analysis, outlet tier, journalist tracking | 5-10 pages + appendix |
| Crisis Response | Speed, severity assessment, narrative tracking | Real-time mention velocity, sentiment shift, top amplifiers, recommended response | 1 page, updated hourly |
The executive summary is the hardest part to write well. It needs to compress a month of coverage into three paragraphs that a CEO can read between meetings and still walk away knowing whether the brand’s public position improved or deteriorated. Start with the verdict. Support with two or three data points. Close with what’s changing next.
Step-by-Step: Building Your First Media Monitoring Report
If you’re starting from zero, don’t try to monitor everything on day one. Start narrow, prove the value, then expand.
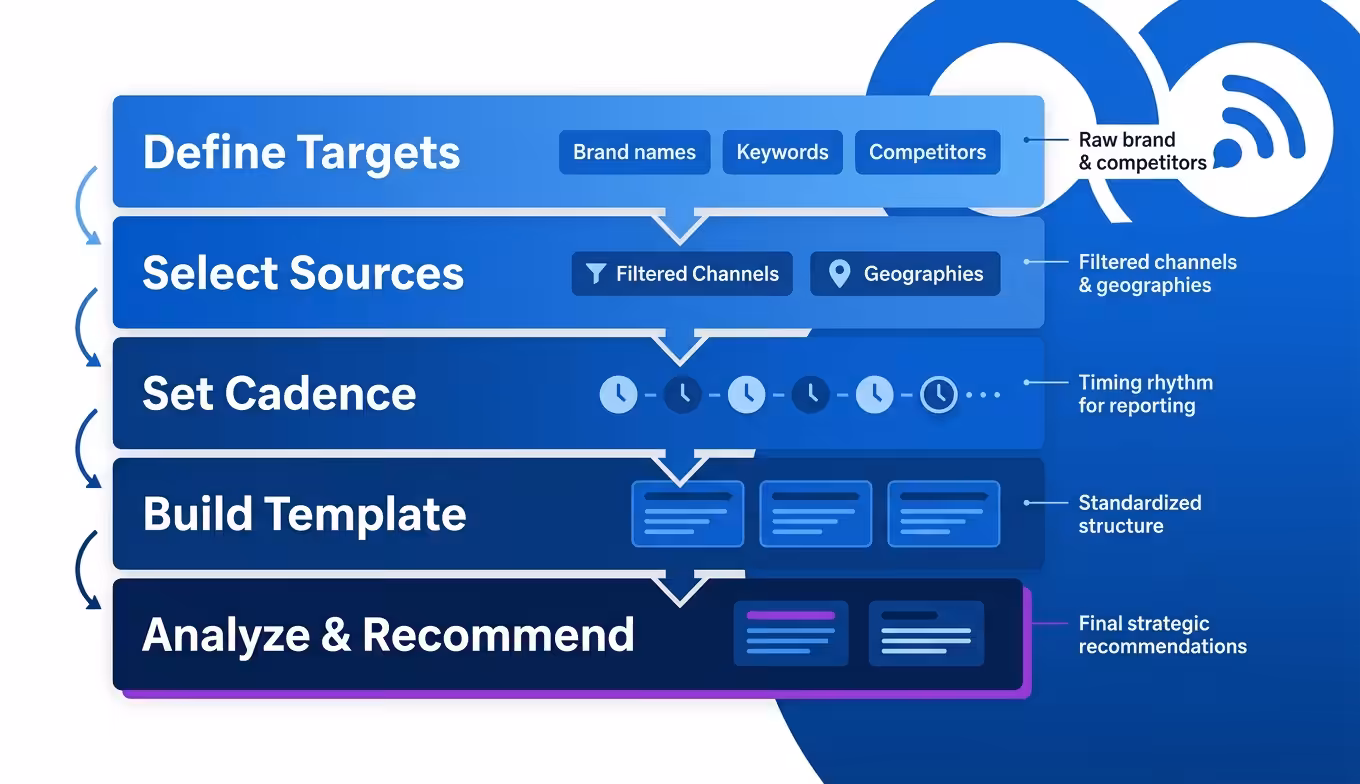
Step 1: Define What You’re Monitoring and Why
Pick your primary monitoring targets. At minimum: your brand name (including common misspellings), your CEO or public-facing executives, your top two competitors, and one or two industry topics that affect your market positioning. Write down the business question each target answers. “We monitor [Competitor X] because we need to know when they launch new features before our sales team gets blindsided.”
Step 2: Choose Your Sources and Channels
Don’t default to “everything.” If your buyers read industry trade publications and LinkedIn but don’t use Reddit, weight your monitoring accordingly. Most media monitoring tools let you filter by source type, geography, and language. Use those filters aggressively.
Step 3: Set Your Reporting Cadence
Weekly reports work for most teams. Monthly reports work for executive summaries and board decks. Daily or real-time monitoring is reserved for crisis situations or major launches. Pick the cadence that matches your decision-making speed, if nobody acts on the data between reports, you’re reporting too often.
Step 4: Build the Template
Lock your structure so reports are comparable over time. A shifting format makes trend analysis impossible. Your template should include: executive summary, mention volume and trend, sentiment breakdown, share of voice, top coverage highlights (with links), competitive comparison, and recommendations.
Step 5: Analyze, Don’t Just Aggregate
This is where most teams stop too early. Pulling data into a template isn’t analysis. Analysis means explaining why the numbers moved, connecting coverage patterns to business events, and recommending specific actions. “Negative sentiment increased 11%, driven primarily by three articles about our pricing change. Recommended response: publish a pricing FAQ and brief the sales team with talking points.” That’s a report that changes behavior.
The AI Coverage Gap Most Reports Miss
For the per-platform walkthroughs behind an AI-coverage addendum, see checking brand mentions in ChatGPT and the Perplexity brand audit, and tracking your brand across LLMs covers the cross-platform cadence that feeds directly into the AI section described below.
Here’s an opinion most monitoring guides won’t give you: if your media monitoring report only covers traditional and social channels, it’s already incomplete.
In 2026, a growing share of how people discover and evaluate brands happens inside AI-generated responses, ChatGPT, Perplexity, Gemini, Google AI Overviews. When someone asks an AI assistant “What’s the best project management tool for remote teams?” and your competitor gets named but you don’t, that’s a media mention that never appears in your Meltwater dashboard.
Traditional monitoring tools weren’t built to track this. They scrape published web pages, broadcast transcripts, and social feeds. They don’t query AI models to see whether your brand is being recommended in conversational search. That’s a blind spot, and it’s widening.
The pattern we see in monitoring audits is that brands with sustained mentions on category-relevant editorial sites are cited in AI answers at materially higher rates than those leaning on owned content alone. Your report should include a section, even a brief one, that tracks whether AI platforms mention your brand in relevant category queries. Tools for tracking brand mentions in AI search are still maturing, and ignoring the channel entirely means your report understates your real competitive position.
Common Metrics That Waste Space in Reports
Some metrics survive in reports through inertia, not usefulness. Cut these or demote them to an appendix.
Ad Value Equivalency (AVE). AVE estimates what your earned coverage would have cost as paid advertising. The PR industry has been moving away from AVE for years because the comparison is fundamentally flawed, editorial coverage and paid ads don’t influence audiences the same way. The AMEC Integrated Evaluation Framework explicitly recommends against using AVE as a primary metric. If your C-suite still asks for it, include it with a footnote, but don’t let it anchor your report.
Raw mention count without context. Already covered, but worth repeating. A thousand mentions during a crisis is bad. A thousand mentions during a launch is (probably) good. The number alone is meaningless.
Follower counts of social amplifiers. A journalist with 4,000 highly engaged followers in your target industry is more valuable than a lifestyle influencer with 200,000 followers who will never buy your product. Report influence by relevance, not size.
How Often Should You Update a Media Monitoring Report?
The right reporting cadence depends on your business velocity and the decisions the report feeds. Weekly reports suit most marketing and PR teams running ongoing campaigns. Monthly reports work for board-level summaries and long-term trend analysis. Real-time dashboards are reserved for active crises or major product launches where response time is measured in hours.
One pattern worth adopting: maintain a living dashboard that updates continuously (most monitoring platforms support this), and produce a curated analysis report on a fixed schedule. The dashboard answers “what’s happening right now.” The report answers “what does it mean and what should we do.” Both are necessary. Neither replaces the other.
If you’re producing reports but nobody references them in meetings or planning sessions, the cadence might be fine, the content probably isn’t actionable enough. Go back to the “so what” test.
Tracking Competitors Inside Your Report
Your brand doesn’t exist in isolation. A monitoring report that only covers your own mentions misses half the strategic picture.
Include a competitor section that tracks at least your top two or three rivals across the same metrics you use for your own brand: mention volume, sentiment, share of voice, and key narrative themes. The goal isn’t to obsess over competitors, it’s to contextualize your own performance.
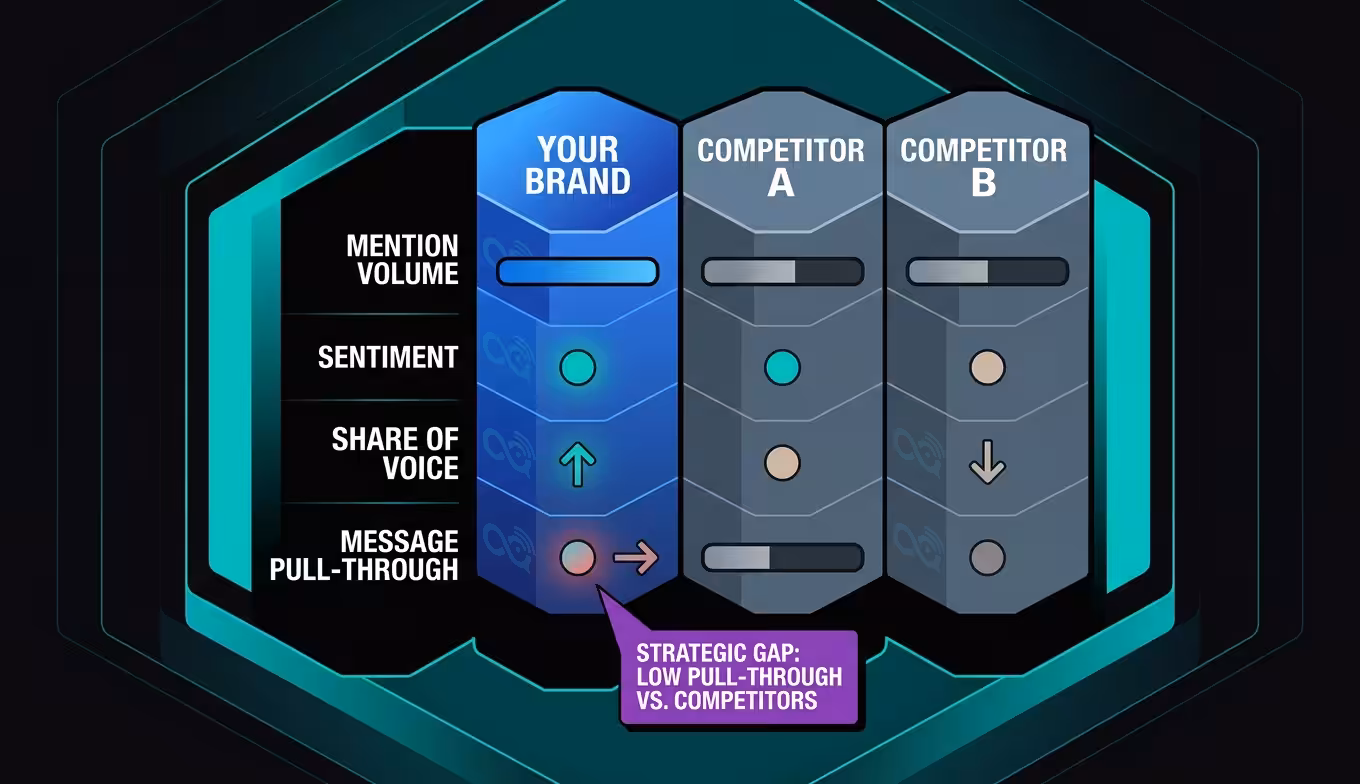
When your share of voice drops from 34% to 28%, the cause might be internal (fewer campaigns, less news) or external (a competitor launched something that dominated the conversation). Without competitor data in the same report, you can’t tell the difference. A detailed competitor analysis approach strengthens every section of the monitoring report because it converts your brand’s raw numbers into relative positioning.
One practical tip: track competitor message themes, not just volume. If a rival starts getting consistent coverage around “AI-powered analytics” and you’re positioned in the same space, that’s a signal to evaluate whether your messaging needs sharpening, before the narrative locks in without you.
Tools That Make Reporting Faster (Without Replacing Judgment)
Automation handles the collection and aggregation layers well. Platforms like Meltwater, Cision, Sprinklr, and Critical Mention can pull mentions from thousands of sources, classify sentiment, and generate dashboards in near real-time. That’s valuable, it saves hours of manual clipping and counting.
Where automation falls short is interpretation. No platform reliably explains why sentiment shifted, whether a trending narrative is a threat or an opportunity, or what your team should do in response. That layer still requires a person who understands the business, the competitive landscape, and the audience.
The best workflow: let the tool handle data collection, filtering, and visualization. Then invest your team’s time in the 20% of the report that creates 80% of the value, the analysis, the “so what,” and the recommendations. If your monitoring platform offers customizable report templates, use them to standardize the data sections so your analysts can focus on interpretation rather than formatting.
For teams also tracking brand sentiment analysis at a deeper level, combining automated sentiment scores with manual qualitative review of top-tier coverage produces the most accurate picture. Trust the machine for volume. Trust your team for nuance.
What a Strong Executive Summary Looks Like
The executive summary is the only section some stakeholders will read. Write it last, after all the analysis is done, so it reflects the complete picture.
A strong executive summary follows this rhythm:
1. Verdict First
“Brand visibility improved in Q2 with a 17% increase in share of voice and a positive sentiment shift driven by the product launch campaign.”
2. Two to Three Supporting Data Points
“Total mentions reached 3,841 across 127 unique outlets. Coverage in tier-1 publications increased 23% quarter over quarter. Competitor X’s share of voice declined from 31% to 24%.”
3. One Risk or Watch Item
“Negative coverage around the pricing update in trade media warrants a response strategy before renewal season.”
4. One Forward-Looking Recommendation
“Recommend increasing executive thought leadership placements in Q3 to sustain the momentum from launch coverage.”
That’s it. Four components. Half a page. A busy executive can absorb it in 90 seconds and walk into a meeting knowing the brand’s media position without reading the full report.
Mistakes That Undermine Report Credibility
The credibility mistake we see most often when reviewing monitoring reports is a team that counts every mention as equivalent, regardless of source tier. One placement in a category-defining trade publication can move pipeline in ways a hundred low-relevance roundups can’t, and when the executive summary hides that distinction the whole report reads like noise. Tier your sources in the appendix and surface the top-tier movements on page one.
Even well-structured reports can lose trust quickly. These are the credibility killers.
Cherry-picking positive coverage. If the report only highlights wins and buries negative mentions in an appendix, leadership will eventually find out, and they’ll stop trusting the report entirely. Include negative coverage prominently. Frame it with context and a recommended response. That’s how you build credibility, not by hiding problems.
Inconsistent methodology between periods. If you changed your keyword list, added a new source, or adjusted your sentiment model between reporting periods, say so. Otherwise, a quarter-over-quarter “improvement” might just be measurement noise. Methodological transparency is boring but it’s what makes trend analysis reliable.
Presenting correlation as causation. “We launched the campaign and mentions increased 40%.” Maybe. Or maybe a competitor had a public crisis and journalists came to you for commentary. Don’t overstate what the data proves. Honest interpretation builds more long-term trust than inflated claims. (Yes, this applies even when the inflated version would make your team look better.)
One of the simplest inputs into a media monitoring report is a standing Google News alert, see our guide on creating a Google News alert if that piece is not yet set up.
Frequently Asked Questions
What is a media monitoring report used for?
A media monitoring report is used to track, measure, and analyze how a brand appears across news, social media, broadcast, and digital channels, then translate those findings into strategic recommendations. PR teams use it to prove campaign impact. Marketing leaders use it to benchmark against competitors. Executives use it to assess brand reputation and spot emerging risks.
How long should a media monitoring report be?
Length depends on the audience. An executive summary should fit on one page. A full tactical report for the PR team might run 5-10 pages plus appendices. The governing rule: if a section doesn’t lead to a decision or action, cut it. A three-page report that drives strategy beats a twenty-page report that collects dust.
Can I build a media monitoring report with free tools?
You can get a basic version started. Google Alerts, free social listening tools, and manual tracking in a spreadsheet will cover low-volume monitoring. But free tools lack automated sentiment analysis, share of voice calculations, and cross-channel aggregation. Once you’re monitoring more than one brand across multiple channels, the manual overhead becomes unsustainable. That’s the point where a dedicated monitoring platform pays for itself in time savings alone.
Should a media monitoring report include AI search mentions?
In 2026, it should, even if the coverage is limited. AI platforms like ChatGPT, Perplexity, and Gemini are influencing how buyers discover and evaluate brands. Imagine a prospect asks an AI assistant about solutions in your category and your competitor gets recommended while you don’t. That’s a visibility gap your traditional monitoring dashboard won’t catch. Even a brief section tracking AI mentions adds a forward-looking dimension to your report that most competitors are still ignoring.
Adapting Your Report as AI Surfaces Mature
The reporting stack is shifting. Static PDF reports sent monthly are giving way to live dashboards with curated analysis layers on top. AI-assisted summarization is making it faster to generate first drafts of executive summaries. And the definition of “media” keeps expanding, podcasts, video transcripts, AI-generated answers, and community forums all produce mentions that didn’t factor into monitoring five years ago.
The brands that will get the most value from monitoring reports in the next two years are the ones that treat the report as a decision-making tool, not a record-keeping exercise. Structure it around questions your team is actually trying to answer. Update the metrics when the business questions change. And make sure every section ends with something someone can do, not just something they can know.
If you want a baseline before committing to a tool or process, request a quick AI visibility audit. We’ll run 25 category-relevant prompts across ChatGPT, Perplexity, Gemini, and Google AI Overviews so you can see exactly which sources each platform trusts for your category, and which competitors are capturing citations you’re not.
Written by the BrandMentions editorial team. AI-assisted drafting with human editorial oversight, fact-checking, and final review.