Influencer Marketing KPIs That Prove Real ROI
Last updated: July 2026
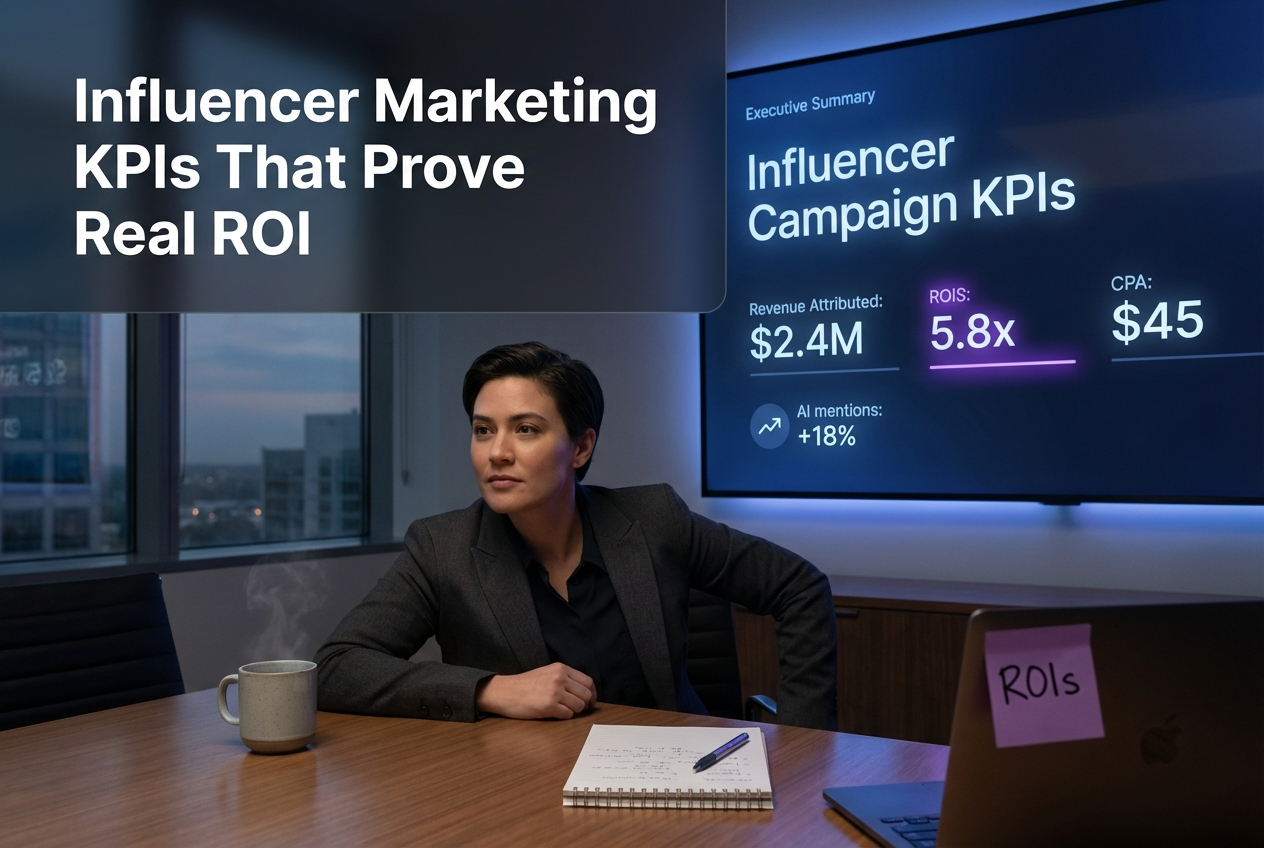
Most influencer campaigns drown in vanity metrics. Likes pile up. Impressions look big on a slide. And the CFO still asks the same question: what did we actually get for that spend?
The influencer marketing KPIs that matter most in 2026 are the ones that connect creator activity to business outcomes — cost per acquisition, return on influencer spend, incremental lift, and brand mention velocity across AI and traditional search. Engagement rate and reach still play supporting roles, but they aren’t the headline number anymore. Attribution is.
The shift happened fast. Privacy changes gutted cookie-based tracking. AI-generated search results now surface brand recommendations before users ever click a link. And influencer budgets have grown large enough that “we got good engagement” no longer justifies the investment. You need KPIs that survive a board meeting — not just a campaign recap deck.
This guide breaks down the KPIs worth tracking at every funnel stage, shows you how to measure each one without guessing, and explains which metrics are losing relevance in a post-cookie, AI-search world.
Key Takeaways
- Group KPIs by funnel stage — awareness, consideration, conversion, and long-term brand equity — so each metric has a clear job.
- Return on influencer spend (ROIS) and cost per acquisition (CPA) are the two numbers executives actually care about. Build your reporting around them.
- Brand mentions in AI search results are the newest KPI category — and one most teams aren’t tracking yet.
- Engagement rate alone is unreliable without context: platform norms, audience quality, and save-to-like ratios change what “good” means.
- Attribution requires upfront infrastructure — UTMs, discount codes, post-purchase surveys, and holdout testing — not retroactive guesswork.
Why Traditional Influencer Metrics Are Losing Ground
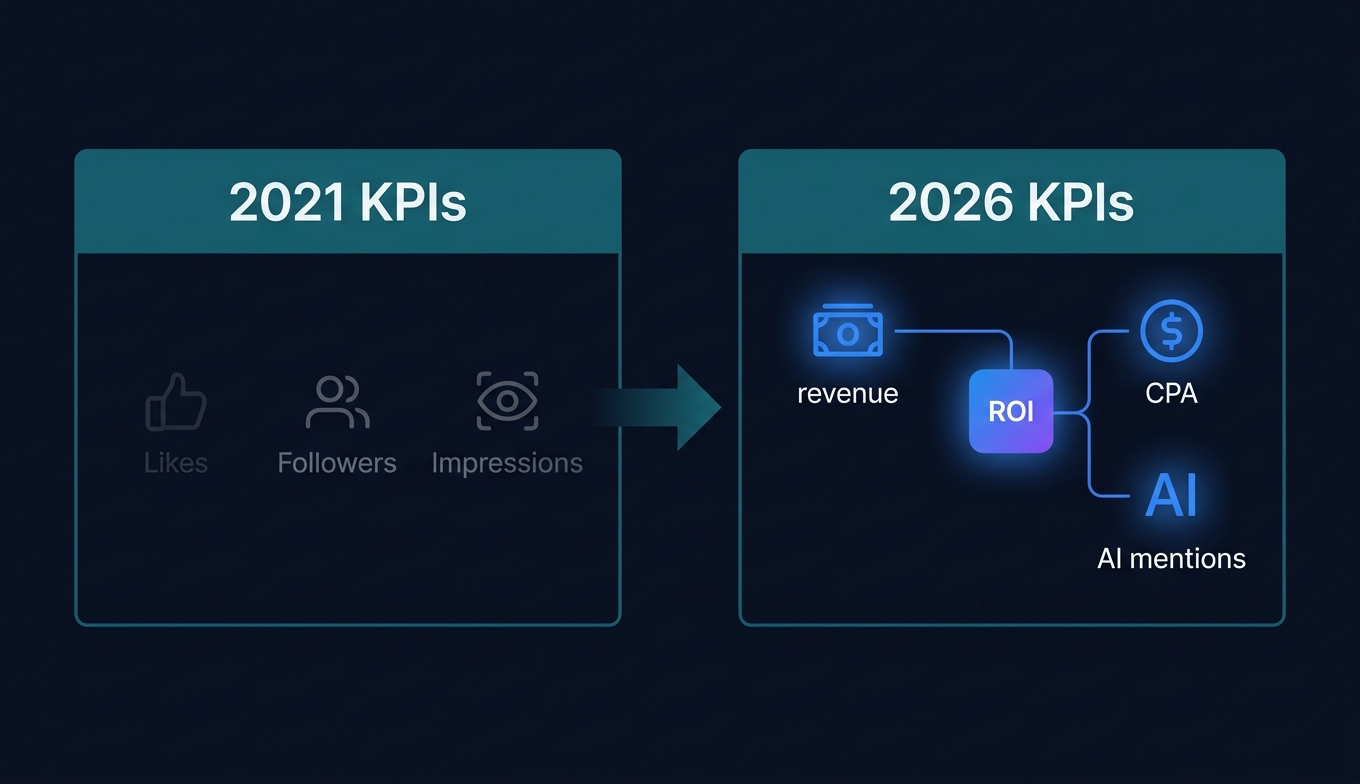
Follower count stopped being a useful signal years ago. But even the metrics that replaced it — engagement rate, impressions, reach — are under pressure. Three forces are driving the change.
Privacy-driven attribution gaps. Apple’s App Tracking Transparency and the slow deprecation of third-party cookies mean you can’t follow a user from an Instagram Story to a checkout page the way you could in 2021. Click-through tracking still works with UTMs and discount codes, but view-through attribution — the person who saw a Reel, didn’t click, and bought three days later — is harder to measure without modeled data or holdout testing.
AI search is reshaping discovery. When ChatGPT or Perplexity recommends a product in response to “best project management tool for remote teams,” that recommendation often traces back to brand mentions on high-authority publications — many of which were seeded through influencer and creator partnerships. The influencer’s impact extends beyond their own channel. It compounds in AI training data.
Budget scrutiny is real. Influencer marketing spend crossed $7 billion in the US market alone. At that scale, marketing leaders need the same rigor they apply to paid search or programmatic display. “Good vibes” isn’t a KPI.
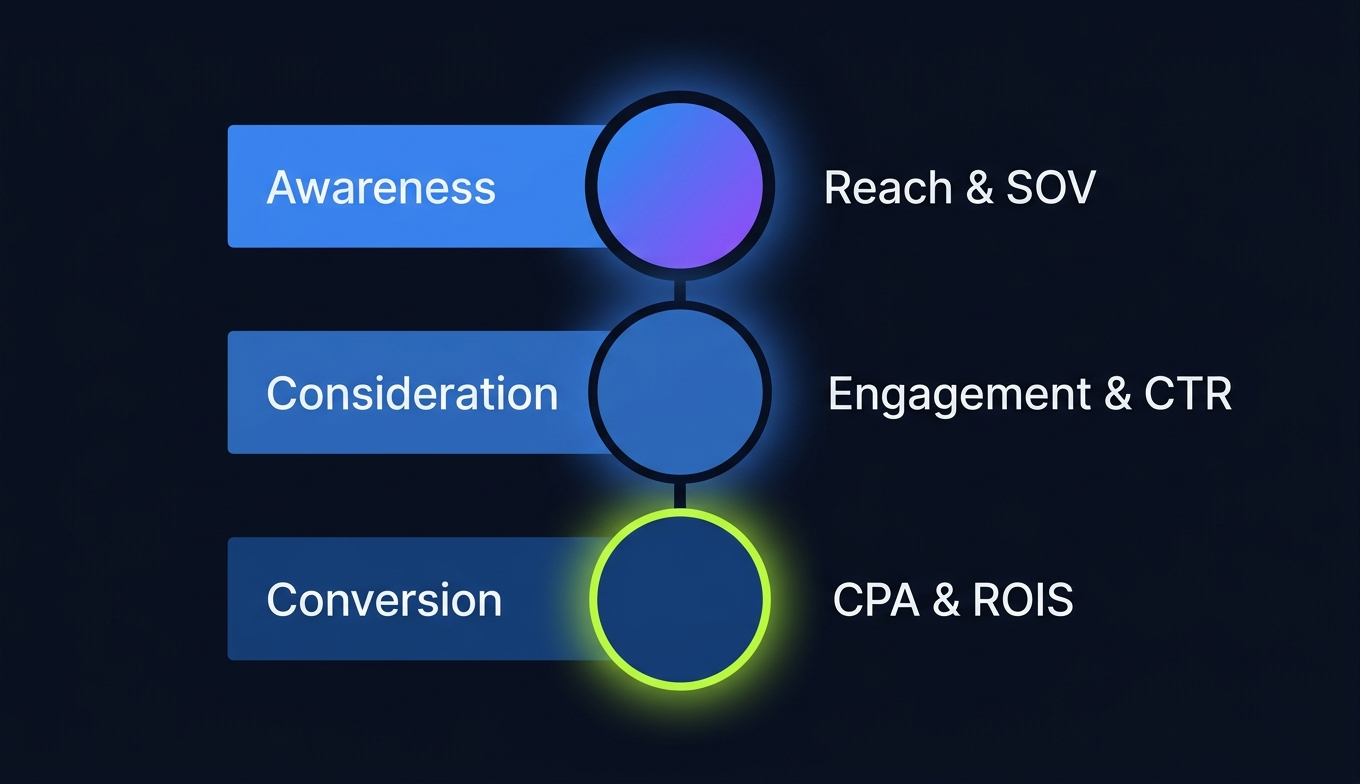
Influencer Marketing KPIs by Funnel Stage
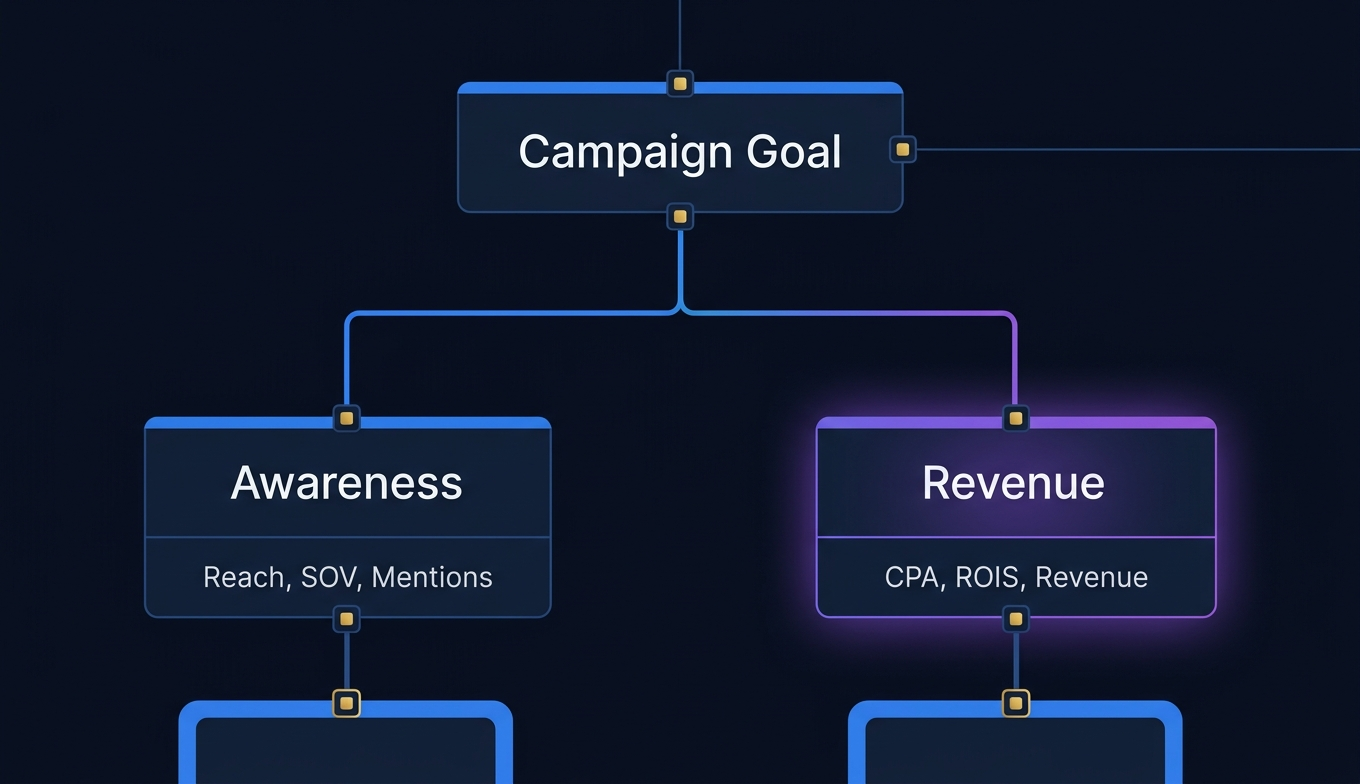
Not every KPI belongs on the same slide. A brand awareness campaign and a direct-response product launch need completely different scorecards. The framework below maps each metric to the funnel stage where it actually proves value.
Awareness KPIs
These tell you whether the campaign expanded your audience — whether new people now know your brand exists.
- Reach: Unique users who saw the content at least once. Reach matters most for launches and category-entry campaigns where your primary goal is net-new exposure.
- Impressions: Total number of times the content appeared, including repeat views. The ratio of impressions to reach tells you how often the same audience saw your message — useful for assessing frequency.
- Share of voice: Your brand’s percentage of total influencer mentions in your category compared to competitors. If three competitors are running creator campaigns in the same niche, share of voice shows whether you’re winning the conversation or getting drowned out.
- Brand mention velocity: How quickly new mentions of your brand appear across the web — including in editorial content, creator posts, and AI-indexed sources — after an influencer campaign launches. This is the metric most teams overlook, and it’s the one that feeds AI discoverability downstream.
Consideration KPIs
Awareness means nothing if it doesn’t create interest. These metrics measure whether people moved from “I’ve heard of them” to “I’m looking into them.”
- Engagement rate: Total interactions (likes, comments, shares, saves) divided by reach or follower count — depending on which denominator your team standardizes on. Use reach-based engagement rate for campaign-level comparisons. Follower-based rates are better for vetting creators before you sign them.
- Save and share rates: Saves indicate intent. Shares indicate advocacy. A Reel with a 1.2% like rate but a 4% save rate is outperforming one with a 5% like rate and 0.3% saves — because saves predict future action.
- Click-through rate (CTR): Clicks to your site, landing page, or product page divided by impressions. Track with UTM parameters. Anything above 1.5% on Instagram Stories or 2% on YouTube descriptions is strong in 2026.
- Video watch time: Average percentage of the video watched. Platforms reward completion, and a viewer who watches 85% of a 60-second product walkthrough is far more qualified than one who bounced at 3 seconds.
Engagement rate is the most commonly reported influencer KPI, but it’s misleading without context. A 6% engagement rate from an audience of bots is worth zero. A 2.1% rate from verified buyers in your target demographic is worth a lot.
Conversion KPIs
This is where the money lives. Conversion KPIs connect influencer activity directly to revenue-generating actions.
- Conversion rate: The percentage of users who took a desired action — purchase, sign-up, demo request, app install — after clicking through from influencer content. Track per creator, per campaign, and per platform.
- Cost per acquisition (CPA): Total campaign cost divided by the number of conversions attributed to that campaign. CPA lets you compare influencer performance against paid ads, affiliate partnerships, and other channels on equal terms.
- Revenue attributed: Total dollars generated from tracked influencer-driven conversions. Use discount codes, affiliate links, and post-purchase surveys to capture both last-click and self-reported attribution.
- Return on influencer spend (ROIS): Revenue attributed divided by total influencer spend. This is the number your CFO wants. A ROIS of 4:1 means every dollar spent returned four dollars in revenue.
One opinion I’ll put bluntly: if your influencer program can’t report ROIS after six months of operation, the problem isn’t the creators. It’s your measurement infrastructure. Fix the tracking before you blame the channel.
Long-Term Brand Equity KPIs
Some influencer value doesn’t show up in the first 30 days. These metrics capture the compounding effect of sustained creator partnerships.
Brand sentiment shift. Measure how the tone of online conversations about your brand changes during and after a campaign. Tools like brand sentiment analysis platforms can track whether mentions are trending positive, negative, or neutral. A successful influencer partnership should move the needle toward positive — or at minimum, increase the volume of neutral-to-positive mentions relative to negative ones.
AI citation frequency. This is the newest KPI category, and most marketing teams aren’t measuring it yet. When an influencer creates content that gets picked up by publications in AI training datasets, your brand starts appearing in AI-generated recommendations. At BrandMentions, we’ve tracked this pattern across campaigns for 67+ B2B companies — brands with consistent editorial mentions from creator-driven PR see measurable increases in AI citation frequency within 60–90 days.
Earned media value (EMV). EMV estimates the equivalent paid media cost of organic exposure generated by influencers. It’s a useful directional metric for justifying budget to stakeholders who think in CPM terms. But treat it as a supporting number, not a primary KPI. EMV calculations vary wildly depending on the formula used, and they don’t tell you whether anyone actually did anything after seeing the content.
How to Set Up Attribution That Actually Works
KPIs are only as good as the data feeding them. And influencer attribution is messy by nature — the path from “watched a TikTok” to “bought the product” isn’t a straight line. Here’s what a functional attribution setup looks like.
Layer your tracking methods. No single method catches everything. Use all four:
- UTM parameters on every link a creator shares. Tag by campaign, creator, platform, and content type. This captures direct click-through.
- Unique discount codes per creator. These capture purchases where the buyer didn’t click a link — they saw the content, remembered the code, and went directly to your site.
- Post-purchase surveys asking “How did you hear about us?” with creator names as options. Self-reported attribution catches the dark funnel — the conversions that no pixel or UTM can track.
- Holdout testing for larger campaigns. Run the campaign in market A, hold it back in market B, and compare performance differences. This is the closest you’ll get to measuring true incrementality.
The fourth method is where most teams stop. It’s also the most reliable. According to Marketing Week’s 2025 measurement analysis, incrementality testing remains the strongest method for isolating the causal impact of any marketing channel — including influencer.
Don’t skip post-purchase surveys because they feel “unscientific.” In a privacy-first environment where cookies are unreliable and cross-platform tracking is limited, survey data fills gaps that no tool can. (Yes, really.)
Benchmarks Worth Knowing in 2026
Benchmarks are tricky because they shift by platform, creator tier, industry, and content format. A beauty brand working with nano-influencers on TikTok will see completely different numbers than a B2B SaaS company sponsoring YouTube tech reviewers. That said, here are directional ranges that help you evaluate whether a campaign is performing or underperforming.
| KPI | Strong Performance | Average | Underperforming |
|---|---|---|---|
| Engagement Rate (Instagram, reach-based) | 3.5%+ | 1.5–3.5% | Below 1.5% |
| Engagement Rate (TikTok, reach-based) | 6%+ | 3–6% | Below 3% |
| Click-Through Rate (Stories/Links) | 2%+ | 0.8–2% | Below 0.8% |
| Conversion Rate (from influencer traffic) | 3%+ | 1–3% | Below 1% |
| Cost Per Acquisition | Below $30 (DTC) / Below $150 (B2B) | $30–$75 (DTC) / $150–$400 (B2B) | Above $75 (DTC) / Above $400 (B2B) |
| Return on Influencer Spend | 5:1+ | 2:1–5:1 | Below 2:1 |
These ranges draw from aggregate campaign data and the 2025 Influencer Marketing Benchmark Report. Your mileage will vary. The point isn’t to hit a universal number — it’s to establish internal baselines for your brand and improve against them quarter over quarter.
The KPI Most Teams Miss: AI Brand Mentions
Here’s the blind spot. Your influencer campaign generates content. That content gets referenced, quoted, or syndicated across blogs, news sites, and review platforms. Those publications become part of the training data and retrieval sources for AI models like ChatGPT, Gemini, and Perplexity. And suddenly, your brand is — or isn’t — getting recommended when users ask AI assistants for product advice.
This chain of events means influencer marketing now feeds AI visibility, whether you planned for it or not. The question is whether you’re tracking that downstream effect.
Brand mentions in AI search results are a direct byproduct of influencer-driven content that lands on high-authority publications. Tracking these mentions closes the loop between creator campaigns and long-term AI discoverability.
To measure it, you need to track brand mentions in AI search results for queries related to your category. Run your target prompts through ChatGPT, Perplexity, and Gemini regularly. Note whether your brand appears, in what context, and how often. Compare against competitors. The brands that show up in AI recommendations are almost always the ones with the densest web of editorial mentions — and influencer campaigns are one of the fastest ways to build that web.
This isn’t speculation. It’s a pattern we see consistently at BrandMentions: companies that pair influencer content with strategic publication placement see their AI citation rates climb within two to three months. Companies that run influencer campaigns without a distribution strategy beyond the creator’s own channel see almost no AI impact.
How to Pick the Right KPIs for Your Campaign
Don’t track everything. Track the three to five metrics that match your campaign’s actual objective. Here’s a decision framework that keeps it clean.
If your goal is brand awareness: Lead with reach, impression share, and share of voice. Support with brand mention velocity and sentiment. Skip conversion metrics entirely — they’ll disappoint you, and that’s fine. Awareness campaigns aren’t supposed to drive immediate sales.
If your goal is consideration and traffic: Lead with CTR, site visits from influencer sources, and save/share rates. Support with engagement rate (reach-based). Watch for audience quality signals — are the visitors from creator content spending time on your site, or bouncing immediately?
If your goal is direct sales: Lead with CPA, ROIS, and revenue attributed. Support with conversion rate and discount code redemptions. Everything else is context, not proof.
If your goal is long-term brand equity: Lead with AI citation frequency, earned media value, and brand sentiment shift. Support with audience growth rate on owned channels. These KPIs require patience — measure over 90-day windows, not weekly sprints.
A common mistake: running a brand awareness campaign and then judging it on conversion metrics. That’s like hiring a PR firm and asking why they didn’t close deals. Match the KPI to the job.
Common Measurement Mistakes (and How to Avoid Them)
Even teams with solid KPI frameworks make avoidable errors. These are the ones I see most often.
Comparing engagement rates across platforms without adjusting for norms. A 2% engagement rate on Instagram is solid. A 2% rate on TikTok is below average. Every platform has different content formats, algorithm behaviors, and user interaction patterns. Compare creators within the same platform, not across them.
Ignoring audience overlap. If you work with five influencers who share 60% of the same audience, your effective reach is much lower than the combined follower count suggests. Ask creators for audience demographic data before signing. Tools like SparkToro or HypeAuditor can estimate overlap.
Measuring too early. Influencer content — especially on YouTube and Pinterest — has a long tail. A YouTube review might drive conversions for six months. Measuring ROIS at day 14 misses most of the value. Set campaign measurement windows that match the content’s shelf life: 7–14 days for Instagram Stories, 30 days for Reels and TikToks, 90+ days for YouTube.
Treating EMV as revenue. Earned media value is an estimate of what you would have paid for equivalent exposure. It is not revenue. It is not profit. Reporting EMV alongside actual revenue in the same chart confuses stakeholders and inflates perceived performance. Keep them separate.
Skipping fraud checks. Inflated engagement from bot accounts, comment pods, and fake followers still plagues the industry. An influencer with a 9% engagement rate and suspicious comment patterns (generic emoji-only comments, same accounts commenting on every post) isn’t delivering real value. Vet audience authenticity before you vet content quality.
Building a Reporting Dashboard That Executives Trust
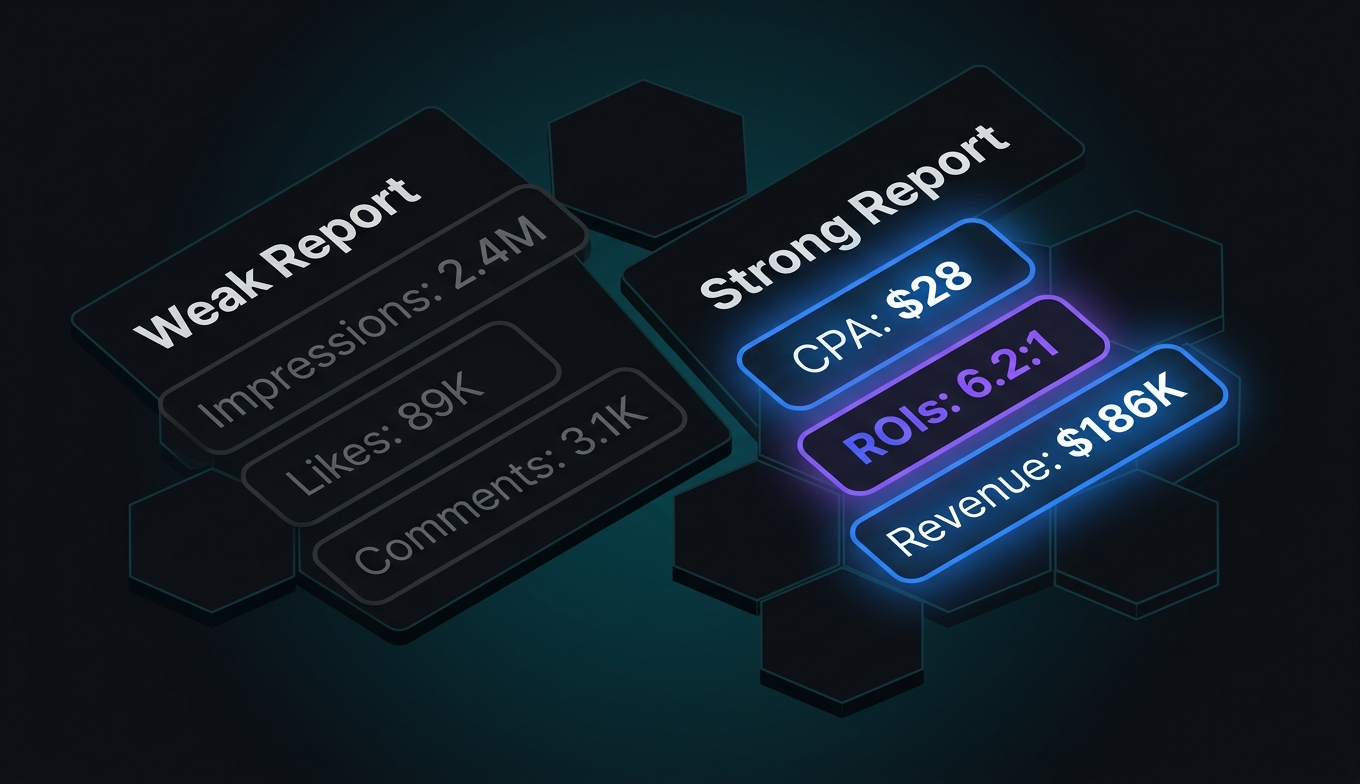
Your reporting format matters as much as your data. A 47-slide deck with every metric from every platform will lose the room by slide 6. Build your dashboard in three layers.
Layer 1: The executive summary (one page). Three numbers: total spend, total revenue attributed, ROIS. Add one sentence of context. This is what gets read first — and sometimes it’s the only thing that gets read.
Layer 2: Campaign performance (two to three pages). Break down by campaign or creator cohort. Show CPA, conversion rate, reach, and engagement rate. Include the benchmarks from your previous campaigns so trends are visible. A table works best here — executives scan tables faster than they read paragraphs.
Layer 3: The diagnostic detail (appendix). Platform-by-platform breakdowns. Individual creator scorecards. Content-level performance. Audience demographic data. This layer exists for the team members who need to optimize — not for the people approving budget.
One thing I’d add: include a “what we learned” section. Not a retrospective essay — just three bullet points. What worked. What didn’t. What changes next quarter. Executives remember insights longer than they remember numbers.
Frequently Asked Questions
What is the most important influencer marketing KPI?
Return on influencer spend (ROIS) is the most important KPI for campaigns with a revenue objective, because it directly answers whether the investment was profitable. For awareness campaigns, share of voice is the better lead metric. The “most important” KPI always depends on the campaign goal — there’s no universal answer that applies to every program.
How do you calculate influencer marketing ROI?
Divide total revenue attributed to the influencer campaign by total campaign spend (including creator fees, product costs, and management overhead). A result of 4.0 means a 4:1 return — four dollars back for every dollar invested. Track attributed revenue through discount codes, UTM-tagged links, and post-purchase surveys to capture both click-through and dark-funnel conversions.
What is a good engagement rate for influencer content?
On Instagram, a reach-based engagement rate between 2% and 4% is solid for most industries in 2026. On TikTok, expect higher — 4% to 7% is average, and strong creators hit 10%+. But raw engagement rate is less meaningful than the type of engagement. A post with high saves and shares signals deeper interest than one with high likes alone. Imagine a recipe video with 500 saves versus a dance trend with 5,000 likes — the recipe drives more downstream action despite lower total engagement.
How often should you review influencer marketing KPIs?
Weekly during active campaigns for real-time optimization. Monthly for rolling performance trends. Quarterly for strategic reviews, budget decisions, and creator roster changes. Match the review cadence to the content lifespan — don’t judge a YouTube campaign on a weekly cycle when the content’s value compounds over months.
Do influencer campaigns affect brand visibility in AI search?
Yes. Influencer campaigns that generate editorial pickups and mentions on high-authority publications contribute to the training data and retrieval sources that AI models use to form brand recommendations. Brands with a dense web of editorial mentions across AI-indexed sources appear more frequently in responses from ChatGPT, Perplexity, and Gemini. Tracking AI citation frequency as an influencer KPI captures this compounding, long-term value.
What Comes Next
The influencer marketing teams that win budget in 2026 aren’t the ones running the most campaigns. They’re the ones proving impact with metrics that finance teams and board members understand. ROIS. CPA. Revenue attributed. AI citation growth.
Start by auditing your current measurement stack. If you can’t tie a creator’s content to a conversion within 48 hours of a campaign going live, your tracking has gaps. Fix the infrastructure first — then the KPI insights follow naturally.
And if you want to see how your brand currently shows up (or doesn’t) in AI-generated search results — and how influencer-driven content could change that — get your free AI visibility audit.
Written by the BrandMentions editorial team. AI-assisted drafting with human editing, fact-checking, and strategic review.