
Share of voice (SOV) measures the percentage of market conversation, visibility, or attention your brand captures compared to competitors. It’s the metric that tells you whether your brand is leading the discussion in your category — or getting drowned out by rivals who show up more often, more prominently, and across more channels.
But here’s what most SOV guides miss: as of 2026, “market conversation” no longer happens only on social media, search engines, and news outlets. AI assistants — ChatGPT, Gemini, Perplexity, Claude, Copilot — now recommend brands directly to users millions of times per day. If your brand isn’t part of those AI-generated answers, your share of voice has a blind spot that’s growing fast.
This article breaks down how to measure share of voice across every channel that matters in 2026, including the AI visibility layer most competitors still ignore. You’ll get the formulas, the tools, and a practical framework for turning SOV data into growth decisions.
What You’ll Learn
- What share of voice measures and why it predicts market share growth
- How to calculate SOV across paid search, organic search, social media, PR, and AI platforms
- The difference between share of voice and market share — and how they connect
- Why AI search visibility is the newest and fastest-growing SOV channel
- Which tools track SOV accurately in 2026, by channel
- A step-by-step process for building an SOV measurement system that drives budget decisions
- How to increase your share of voice without inflating spend
How Share of Voice Differs From Market Share
Share of voice and market share measure different things, but they’re tightly linked.
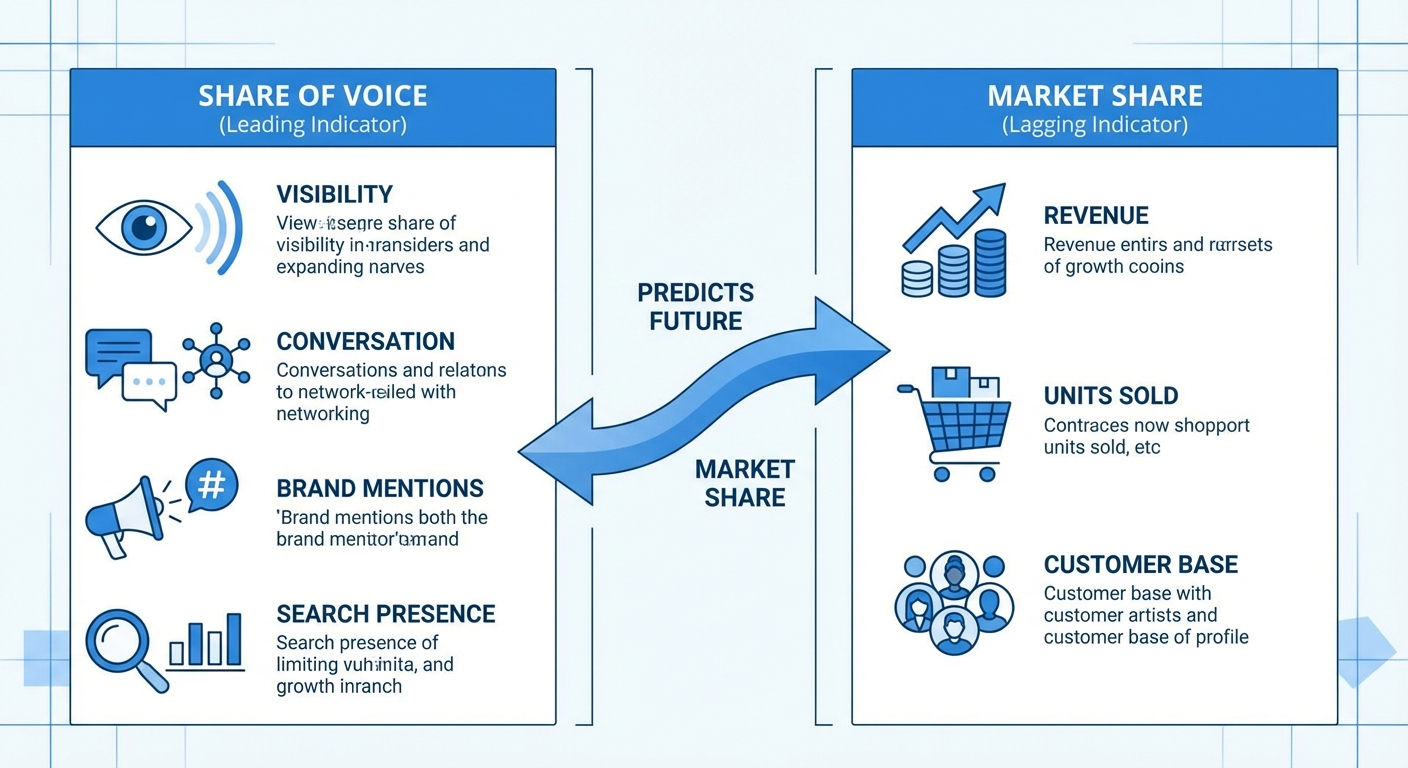
Market share is a lagging indicator. It reflects the percentage of total revenue or units sold your brand captures in a category. It tells you what already happened.
Share of voice is a leading indicator. It reflects the percentage of total visibility, conversation, or attention your brand captures. It tells you what’s likely to happen next.
The connection between them is well-documented. Research by Les Binet and Peter Field, published through the IPA, studied 171 campaigns across major categories between 1980 and 2010. They found that brands whose SOV exceeded their market share — a gap called excess share of voice (ESOV) — grew market share over time. Specifically, each 10 percentage points of ESOV correlated with roughly 0.5% annual market share growth.
In plain terms: if you want to grow your market share from 10% to 15%, you need to sustain share of voice above 15% long enough for visibility to convert into consideration, then purchase, then revenue.
This relationship gives SOV its strategic power. It transforms “increase brand awareness” — a vague goal — into a specific, measurable target.
The Share of Voice Formula
The core formula works the same regardless of channel:
Share of Voice = (Your Brand’s Metric ÷ Total Market Metric) × 100
What changes is the metric you plug in. Social media SOV uses brand mentions. Paid search SOV uses impression share. Organic search SOV uses estimated traffic from tracked keywords. PR SOV uses media placements.
Here’s a quick example. If your brand receives 3,000 social media mentions in a month, and the total mentions across your competitive set is 15,000, your social media SOV is:
(3,000 ÷ 15,000) × 100 = 20%
The formula is simple. The hard part is gathering accurate data for the “total market metric” — which requires defining your competitive set and choosing the right measurement tools for each channel.
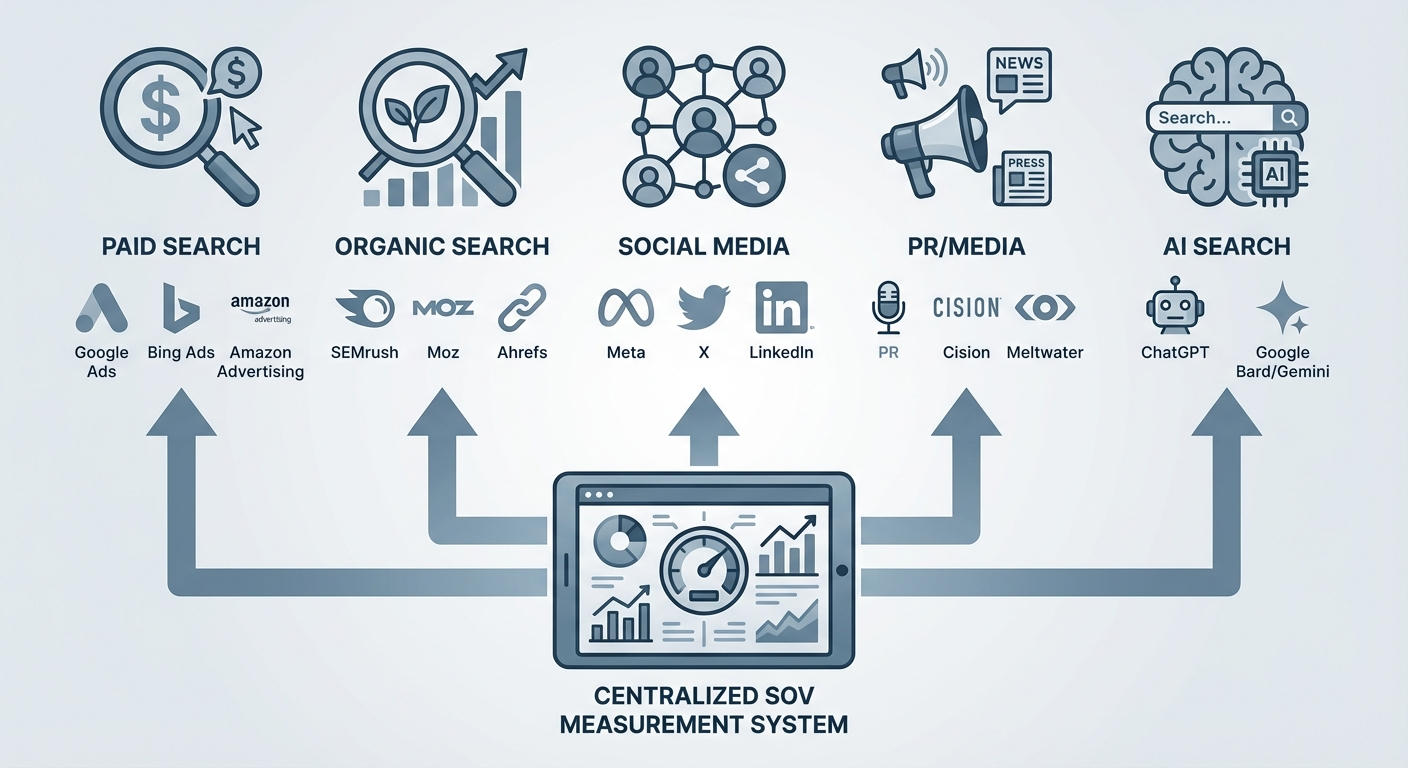
How to Measure Share of Voice by Channel
SOV isn’t one number. It’s a set of channel-specific measurements that together reveal your brand’s total visibility. Here’s how to measure it across every channel that matters in 2026.
Paid search share of voice
Paid search SOV measures how often your ads appear compared to how often they could appear. Google Ads calls this impression share — the percentage of total eligible impressions your ads captured.
To find your impression share in Google Ads:
- Go to the Campaigns tab
- Click the columns icon and select Modify columns
- Click Competitive metrics
- Add impression share columns
Google also reports lost impression share due to budget and lost impression share due to rank. These breakdowns tell you exactly why you’re losing visibility — and whether the fix requires more budget or better ad quality.
For competitive context, tools like Semrush and SpyFu estimate which keywords competitors bid on and their approximate spend levels. This helps you understand your paid search SOV relative to specific competitors, not just your own impression ceiling.
Action step: Track paid search impression share weekly for your top 20 revenue-driving keywords. Flag any keyword where impression share drops below 70% — that’s a visibility gap competitors are exploiting.
Organic search share of voice
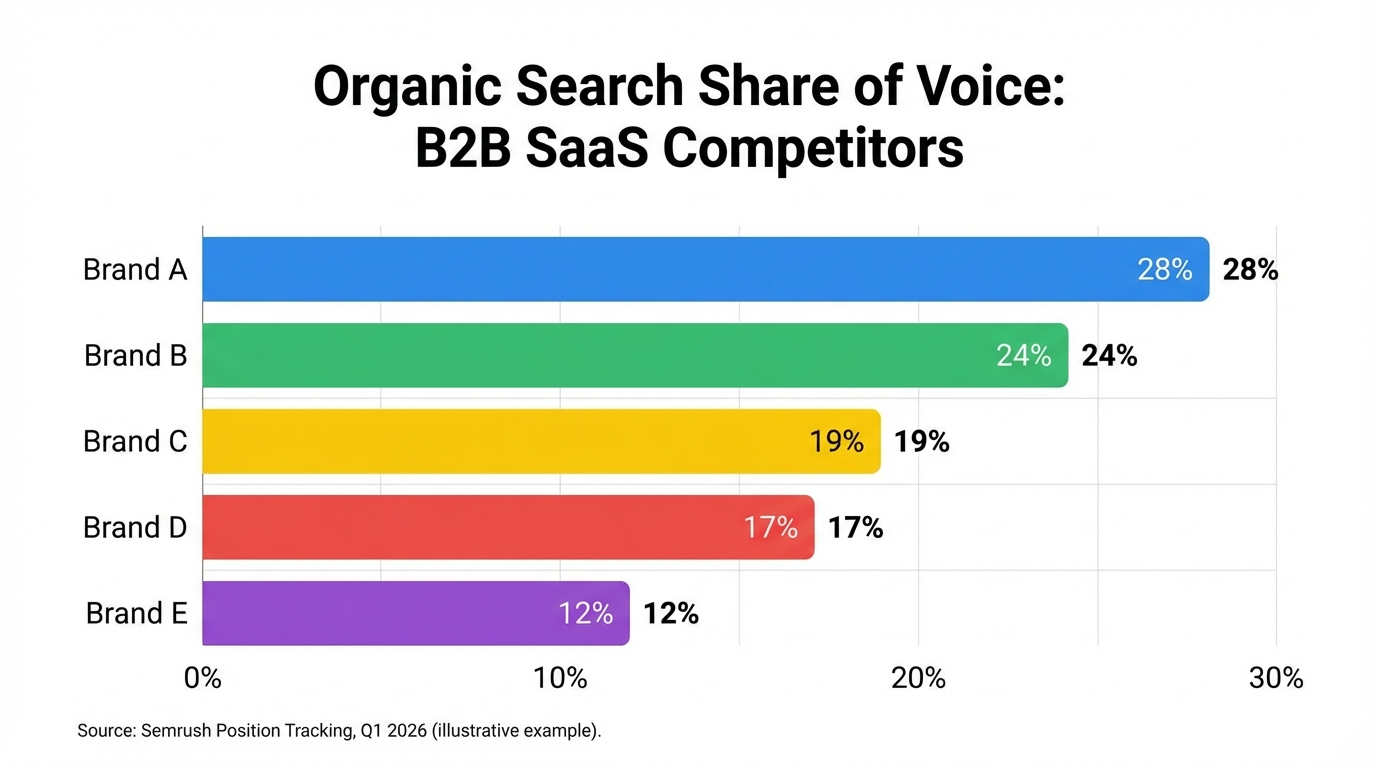
Organic search SOV measures how much of the unpaid search traffic for your target keywords goes to your site versus competitors. Unlike paid search, organic SOV reflects long-term content authority rather than budget allocation.
Tools like Semrush calculate organic SOV through their Position Tracking feature. The tool tracks your rankings for a defined keyword set, estimates traffic based on position-specific click-through rates, and expresses your share as a percentage of total estimated traffic across competitors.
Ahrefs offers a similar capability through its batch analysis and keyword tracking features.
The key to accurate organic SOV: choose a keyword set that reflects how your customers actually search. Include brand keywords, category keywords, and long-tail problem-aware queries. Track the same set over time so you’re measuring trends, not artifacts of keyword selection.
Organic SOV compounds. Unlike paid channels where visibility stops when budget runs out, organic rankings persist and grow as content accumulates authority. This makes organic SOV one of the highest-leverage metrics for brands with limited advertising budgets.
Social media share of voice
Social media SOV tracks how much of the conversation in your category your brand owns. This includes direct mentions, hashtags, @tags, and engagement metrics across platforms like LinkedIn, X (formerly Twitter), Instagram, TikTok, and Facebook.
Social listening tools — Brandwatch, Sprout Social, Talkwalker, Mention — scan public posts, comments, and discussions to count brand mentions for you and your competitors. Your SOV is your mention count divided by total category mentions.
Raw mention volume only tells half the story. A brand dominating conversation with negative mentions isn’t winning — it’s managing a crisis. Pair mention-based SOV with brand sentiment analysis to understand whether your share of voice is an asset or a liability.
Engagement-weighted SOV adds another dimension. A brand with 15% mention share but 9% engagement rate may generate more actual visibility than a brand with 25% mention share and 1% engagement rate. Track both.
Action step: Calculate social media SOV monthly for your top 3–5 competitors. Segment by platform to identify where you lead and where you’re invisible.
PR and media share of voice
Media SOV measures how often your brand appears in news outlets, industry publications, and editorial content compared to competitors. This channel reflects earned media strength — the coverage you generate through PR, thought leadership, and newsworthiness.
Media monitoring tools like Prowly, Meltwater, and Cision track brand mentions across thousands of publications. Your media SOV is your mention count as a percentage of total competitor mentions in tracked outlets.
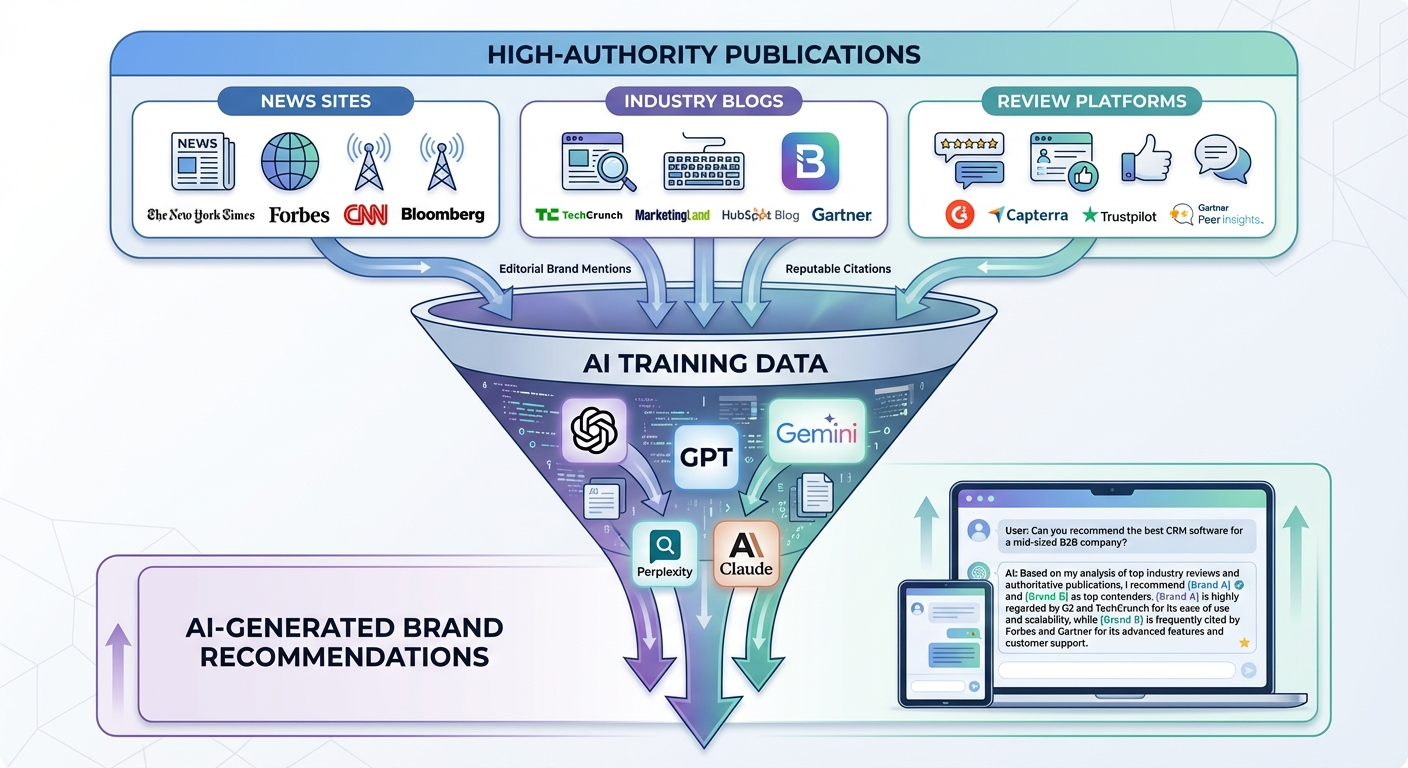
Media SOV carries outsized weight for one reason most marketers overlook: AI training data. Large language models learn brand-category associations from the editorial content they’re trained on. Brands with consistent, high-authority media mentions are more likely to appear in AI-generated recommendations. This makes media SOV a direct input to AI visibility — a connection we’ll explore in the next section.
AI search share of voice — the channel most brands still miss
As of 2026, AI assistants like ChatGPT, Google Gemini, Perplexity, Claude, and Microsoft Copilot generate brand recommendations in response to millions of user queries daily. When someone asks “What’s the best CRM for startups?” or “Which project management tool should I use?”, AI models produce answers that include — or exclude — specific brands.
AI share of voice measures how often your brand appears in AI-generated answers compared to competitors for category-relevant queries. This is the newest SOV channel and the one growing fastest in strategic importance.
Unlike traditional search or social media, AI SOV isn’t driven by real-time bidding or posting frequency. It’s driven by what AI models learned during training — from editorial content, high-authority publications, product reviews, and structured data sources. Brands that appear consistently across these sources during training data collection cycles earn higher AI recommendation rates.
According to a 2025 Gartner forecast, traditional search engine traffic is expected to decline 25% by 2027 as users shift to AI-powered answers. This makes AI SOV a growth metric, not a niche curiosity.
Tracking AI SOV requires specialized tools. You can check whether AI mentions your brand by querying platforms manually, but systematic measurement requires platforms built for tracking brand mentions across AI search platforms. These tools run category-relevant queries across multiple AI models, record which brands appear in responses, and calculate your share of AI recommendations over time.
If you’re investing in content, PR, and SEO but not tracking whether that work translates into AI recommendations, you’re measuring inputs without measuring one of the most important outputs.
Building an SOV Measurement System That Drives Decisions
Collecting SOV data across channels is useful. Turning that data into budget decisions and growth strategy is where the value lives. Here’s a practical framework.
Step 1: Define your competitive set
Choose 4–8 direct competitors. Include your top 3–5 rivals plus 1–2 aspirational brands you want to displace. Your competitive set may vary by channel — paid search competitors often differ from social media competitors. That’s fine. SOV is channel-specific.
Step 2: Select metrics by channel
Match the right metric to each channel:
- Paid search: Impression share (Google Ads native data)
- Organic search: Estimated traffic share from tracked keywords (Semrush, Ahrefs)
- Social media: Mention volume and engagement share (Brandwatch, Sprout Social, Talkwalker)
- PR/media: Editorial mention count (Prowly, Meltwater, Cision)
- AI search: Brand appearance rate in AI-generated answers (AI visibility analytics tools)
Step 3: Establish measurement cadence
Not every channel needs the same frequency:
- Paid search SOV: Weekly — this channel moves fast
- Social media SOV: Monthly — short-term spikes are less strategically meaningful
- Organic search SOV: Monthly — rankings shift gradually
- PR/media SOV: Monthly or quarterly
- AI search SOV: Monthly — AI training data updates on irregular cycles, so monthly tracking captures meaningful shifts
Step 4: Compare SOV to market share
This is the analysis that converts data into strategy. For each channel, compare your SOV to your estimated market share:
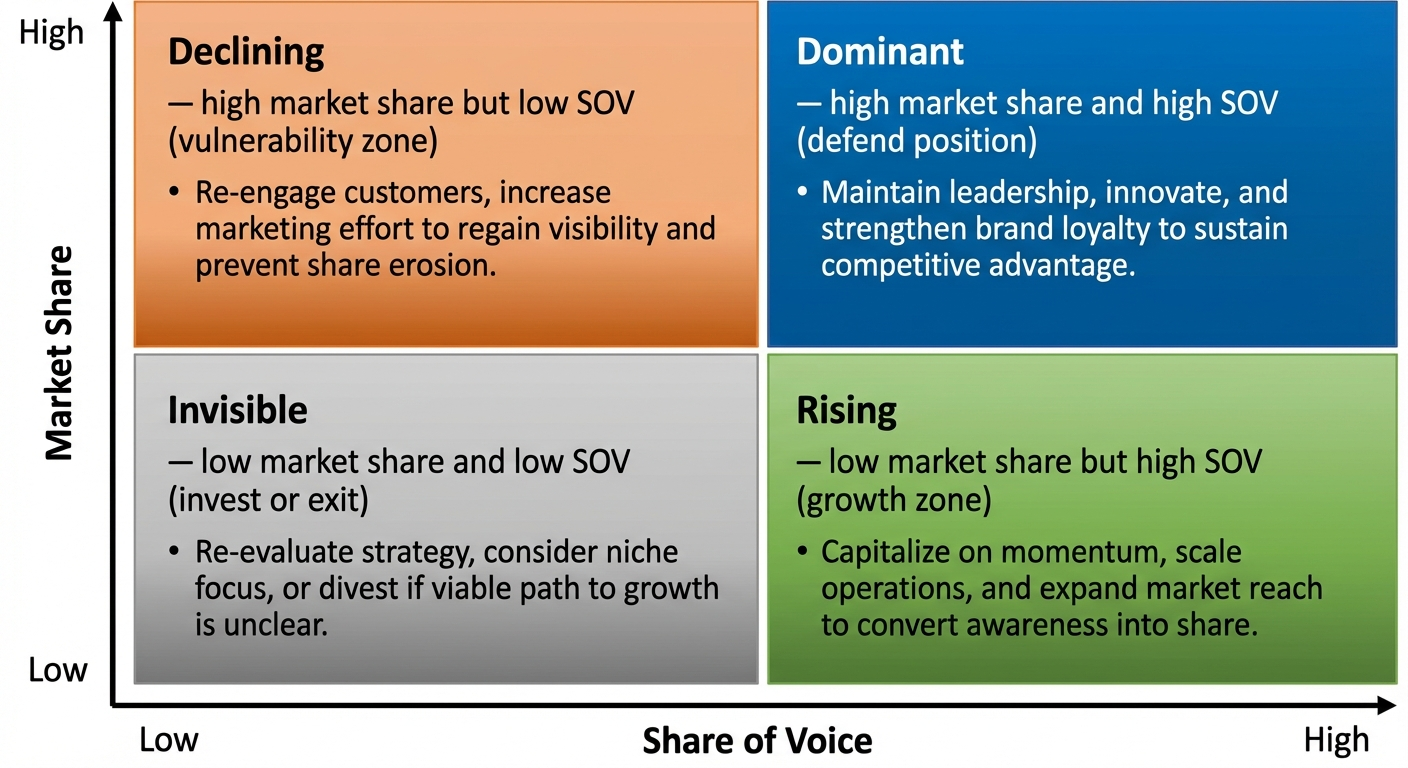
- SOV > Market share: You’re building visibility that predicts growth. Maintain investment.
- SOV = Market share: You’re maintaining position. Acceptable if defending, insufficient if growing.
- SOV < Market share: You’re underinvested. Competitors are eroding your mental availability. This predicts market share decline.
Step 5: Allocate budget based on visibility gaps
Use the SOV-to-market-share comparison to guide investment. If your organic search SOV is 8% but your market share target is 15%, you have a specific visibility deficit to close. If your social SOV is 22% but your market share is 10%, you may be over-indexed in social relative to other channels where visibility is weaker.
This approach replaces "spread budget evenly across channels" with "invest where visibility gaps threaten growth objectives." It also provides objective justification for budget requests — you're not arguing for more spend based on preference, you're demonstrating specific visibility gaps with quantified growth implications.
How to Increase Your Share of Voice Without Inflating Spend
Increasing SOV doesn't always require increasing budget. Strategic visibility gains often come from efficiency improvements, content leverage, and channel prioritization.
Improve ad quality to win more impressions at the same budget
In paid search, impression share depends on both budget and ad rank. Better quality scores — driven by ad relevance, landing page experience, and expected click-through rate — earn more impressions per dollar. Improving quality scores by even one point can increase impression share 10–15% without additional spend.
Build topical authority in organic search
Organic SOV grows when you rank for more queries and rank higher for existing ones. Publishing comprehensive, interlinked content clusters around core topics builds the topical authority that search engines reward. This compounds — each new piece strengthens existing rankings while capturing additional keywords.
For a deeper look at how brand mentions support SEO and organic visibility, this approach pairs well with earning editorial mentions on high-authority sites.
Create content that earns organic amplification
Social SOV increases when your audience shares your content with their networks. Content that educates, provides original data, or takes a clear stance on industry debates earns more shares than generic promotional posts. One piece of genuinely useful content can generate more mentions than a month of routine social posts.
Earn editorial mentions on publications AI models learn from
This is the highest-leverage strategy for building AI share of voice in 2026. AI models form brand-category associations from the editorial content in their training data. Brand mentions on high-authority publications directly influence whether AI assistants recommend your brand.
Agencies like BrandMentions approach this systematically — placing contextual brand mentions across 140+ high-authority publications that AI models actively learn from during training. In campaigns across 67+ B2B companies, the BrandMentions team found that brands with consistent editorial mentions achieved AI recommendation rates 89% higher than those relying solely on traditional SEO.
The key insight: editorial mentions serve double duty. They increase PR share of voice and media authority and they build AI visibility that compounds across every major AI assistant.
Engage employees as brand advocates
Employee advocacy programs expand reach without additional ad spend. When employees share company content through their personal networks, they introduce your brand to audiences you couldn't reach through owned channels. Content shared by individuals consistently generates higher engagement rates than content shared by brand accounts.
Monitor competitor patterns and time your investment
SOV tracking reveals when competitors increase or decrease their visibility investment. Periods when competitors pull back represent opportunities to capture disproportionate attention at lower cost. Periods when competitors invest heavily may require defensive spending to protect your position.
Using brand monitoring tools to track competitor mention volume and campaign activity gives you the intelligence to time your efforts strategically rather than reactively.
SOV Tools That Work in 2026: A Practical Breakdown
No single tool measures SOV across every channel. Here's what to use where.
| Channel | Recommended Tools | What They Measure |
|---|---|---|
| Paid search | Google Ads (native), Semrush, SpyFu | Impression share, competitor keyword bids, estimated spend |
| Organic search | Semrush, Ahrefs, Sistrix | Keyword visibility share, estimated traffic share, ranking distribution |
| Social media | Brandwatch, Sprout Social, Talkwalker, Mention | Mention volume, engagement share, sentiment, influencer impact |
| PR / media | Prowly, Meltwater, Cision | Editorial mentions, media placement volume, publication reach |
| AI search | AI visibility analytics platforms, manual audits | Brand appearance rate in ChatGPT, Gemini, Perplexity, Claude responses |
For a comprehensive brand mentions report that consolidates visibility data across channels, most teams aggregate tool-specific data into a business intelligence dashboard or structured spreadsheet. The goal is a single view showing SOV trends by channel, by competitor, and over time.
Pro Insight: Don't chase a single "total SOV" number by averaging channels. Channel-specific SOV is where actionable insights live. A brand with 30% social SOV and 5% organic SOV needs a very different strategy than a brand with 15% across both.
What's Changed Since 2024–2025: The AI Visibility Shift
Share of voice as a metric isn't new. What's new in 2026 is the surface area where SOV matters.
Between 2024 and 2025, several shifts reshaped SOV measurement:
- Google AI Overviews became standard. Google now generates AI-powered answer summaries for a large percentage of informational queries. Brands cited in these overviews capture visibility that traditional organic rankings don't fully reflect. Tracking Google AI mentions is now a distinct SOV dimension.
- ChatGPT and Perplexity gained search market share. As of early 2026, a measurable percentage of product research and brand discovery happens through AI assistants rather than traditional search engines. Brands invisible to these platforms lose consideration they never even know about.
- Traditional SOV tools added AI tracking — but slowly. Most established platforms (Semrush, Ahrefs, Brandwatch) are still catching up to AI visibility measurement. Dedicated AI rank trackers for brand mentions have emerged to fill this gap.
- Training data cycles became a strategic factor. BrandMentions tracks when major AI models update their training data and times placements to maximize inclusion in each knowledge refresh cycle. Brands that understand these cycles can influence their AI SOV more effectively than those who treat editorial placement as a one-time event.
The implication: any SOV measurement system built before 2025 is incomplete. If you're tracking paid search, organic search, social, and PR — but not AI — you're measuring four out of five channels where your customers form brand preferences.
For a practical starting point, increasing brand mentions in AI search requires a different playbook than increasing mentions in traditional media or social platforms.
Frequently Asked Questions
What is a good share of voice percentage?
There's no universal "good" percentage — it depends on your market position and growth goals. The most useful benchmark is comparing your SOV to your market share. If your SOV exceeds your market share (creating excess share of voice), the research from Binet and Field suggests you're positioned for growth. A brand with 10% market share and 15% SOV is in a stronger position than a brand with 10% market share and 8% SOV.
How often should I measure share of voice?
Monthly measurement works for most channels and business contexts. Paid search SOV can be reviewed weekly because it fluctuates with bidding and budget changes. Organic search and PR SOV shift more gradually, making monthly or quarterly tracking sufficient. The key is consistency — track the same competitive set and keyword definitions over time so you're comparing apples to apples.
Does share of voice include AI search platforms like ChatGPT?
Traditional SOV definitions don't include AI search, but in 2026, excluding it leaves a significant blind spot. AI assistants now influence brand consideration and purchase decisions for a growing share of users. You can check brand mentions in ChatGPT and other platforms to understand your AI share of voice and close this measurement gap.
Can a small brand have a high share of voice?
Yes — especially in specific channels, niches, or geographic regions. A startup that dominates organic search for a focused set of long-tail keywords can have higher organic SOV than larger competitors who spread their content across broader topics. Share of voice rewards strategic focus, not just budget size.
How does share of voice relate to brand mentions?
Brand mentions are one of the primary inputs to SOV calculations, particularly for social media, PR, and AI search channels. The more frequently your brand is mentioned across high-authority sources relative to competitors, the higher your share of voice. Understanding how brand mentions work is foundational to improving SOV across every channel.
Turning Share of Voice Into a Growth System
Share of voice isn't a metric to check once and file away. It's a strategic system that connects marketing investment to competitive positioning to market share growth.
The brands that grow consistently in 2026 treat SOV as an operating metric — reviewed monthly, compared to market share targets, and used to allocate budget across channels where visibility gaps exist. They measure it across paid search, organic search, social media, PR, and AI search because their customers move fluidly across all five.
Start with three steps this month:
- Audit your current SOV across channels. Use the tools and formulas in this article to establish your baseline. Identify where you lead and where you're invisible.
- Compare SOV to market share. Identify your excess or deficit share of voice. This tells you whether your current investment supports growth or predicts decline.
- Add AI search to your measurement. If you're not tracking whether AI assistants recommend your brand, you're missing the fastest-growing visibility channel in your category. Check what AI says about your brand — and your competitors — to understand where you stand.
The brands that measure share of voice across every channel — and act on what the data reveals — are the ones that capture market share while competitors wonder what changed.
Want to see where your brand stands across AI search platforms? Get a free AI visibility audit and find out which AI assistants recommend you — and which recommend your competitors instead.