If you want the real AI search picture, you need category-level share, not a single chatbot ranking. The short version: ChatGPT leads almost every chatbot-share chart, often sitting between 60% and 79% depending on the panel, while Google still owns roughly 80% of overall search through traditional results plus AI Overviews. Those two facts don’t contradict each other. They describe different categories. This article breaks AI search market share down by platform, category type, region, device, and time period so you can see who leads where, and why the numbers disagree across sources.
The Short Version
- ChatGPT leads standalone AI chatbot share, reported between 60% and 79% depending on the data panel and geography.
- Google still dominates total search at roughly 80%, and most of its AI usage hides inside AI Overviews and AI Mode rather than a separate product.
- Perplexity and Gemini trade the second and third chatbot spots, usually in the 7% to 25% range across different sources.
- Market share figures are directional, not census data, because vendors measure prompts, visits, and sessions differently.
- Category choice changes the story: usage share, citation share, and referral-traffic share rarely line up.
What AI Search Market Share by Category Means
AI search market share by category is the breakdown of AI-powered search usage across distinct segments: platforms, category types, regions, devices, and time periods. It answers “who leads where,” not “which tool is best.”
AI search itself covers search experiences powered by large language models. That includes chatbot assistants like ChatGPT and Claude, answer engines like Perplexity, AI-overview surfaces baked into Google results, and hybrid products that blend chat with live web retrieval.
“By category” can mean several different cuts.
The Five Category Lenses
Platform share
Platform share ranks individual products: ChatGPT, Google Gemini, Perplexity, Microsoft Copilot, Claude, and DeepSeek. This is the cut most charts show.
Category-type share
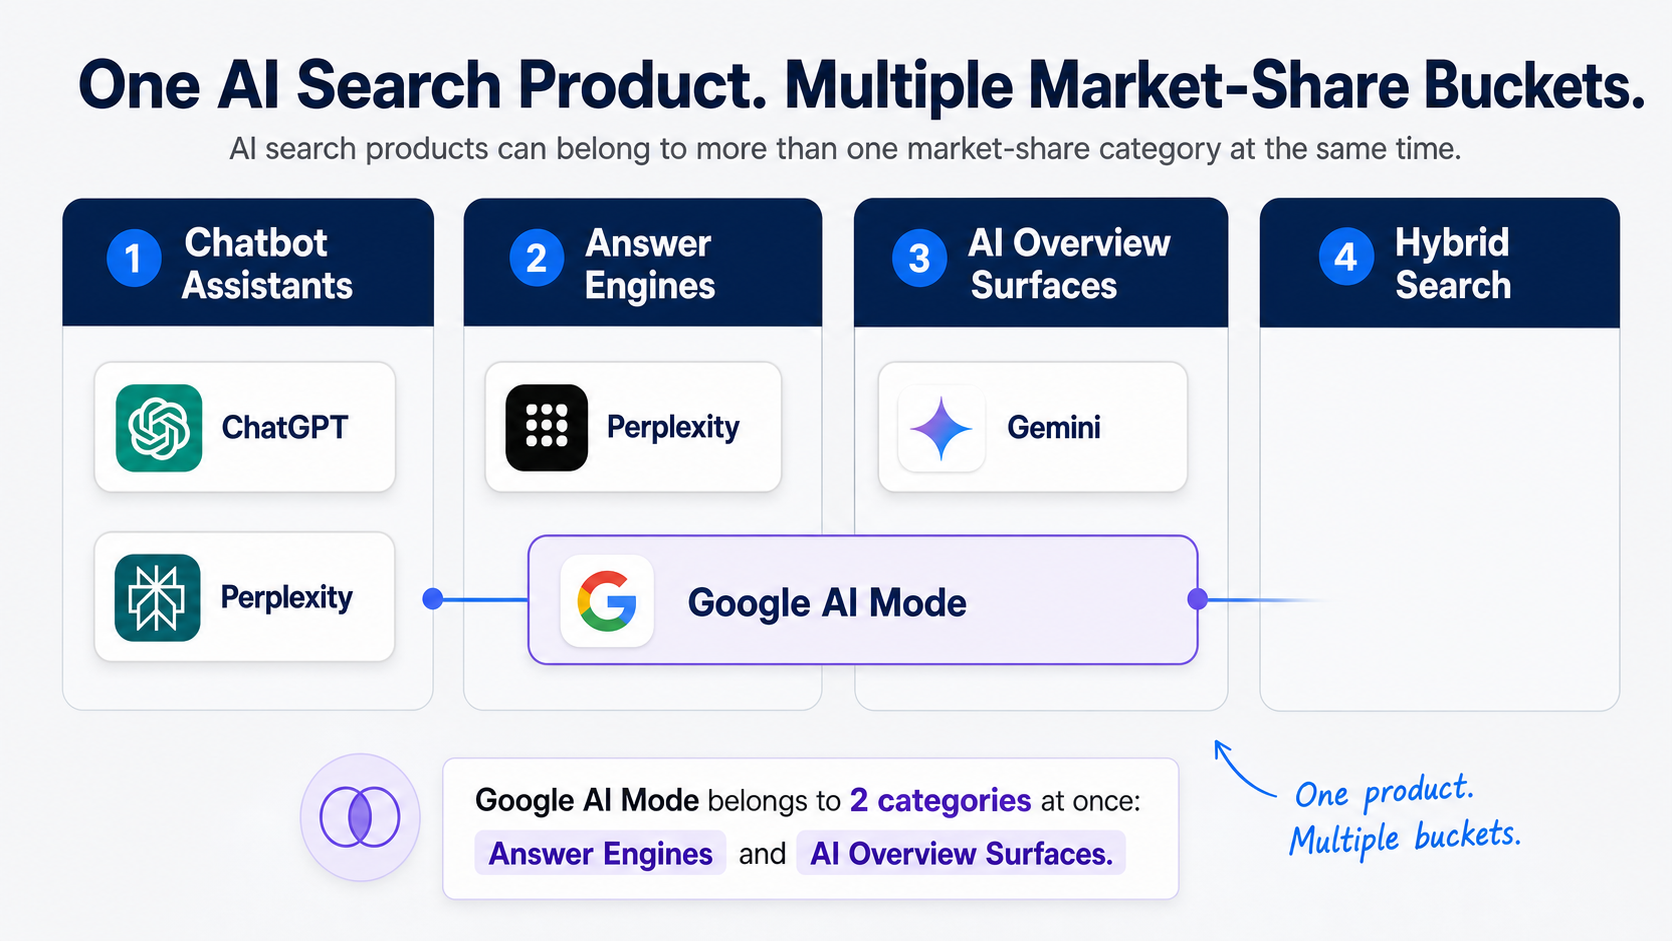
Category-type share groups products by what they do: conversational assistants, dedicated answer engines, AI-overview surfaces, and hybrid search tools. One product can sit in more than one group.
Region share
Region share splits usage across geographies like North America, Europe, and Asia-Pacific. Adoption curves differ by region, so leadership can flip depending on the map.
Device share
Device share separates desktop, mobile, and tablet usage. Workplace research and casual consumer queries land on different devices, which changes the mix.
Time-period share
Time-period share tracks month-over-month or year-over-year movement. It shows whether a leader is extending its lead or losing ground.
Why One Product Appears in Multiple Categories
Google is the clearest example. It runs traditional search, AI Overviews, and AI Mode. In a chatbot-share chart, Google Gemini competes as a standalone product. In an overall-search chart, Google’s AI usage gets counted inside Google’s total. Reading one chart as if it were the other is the most common mistake we see clients make.
One practitioner note worth holding onto: a platform can dominate usage while another dominates citations. ChatGPT gets the most queries, but Perplexity’s source-forward format means it often drives more clicks to the websites it references. Usage leadership and citation leadership are not the same prize.
One more thing to set straight before the numbers. This article uses directional market estimates, not revenue share or perfect census data. StatCounter, Similarweb, and individual vendor research can all report different figures for the same month. That isn’t sloppiness. It’s a measurement gap covered in detail below.
Why Category-Level Share Matters
Category-level share tells you where discovery is shifting and where your traffic risk is rising. A single topline number hides that.
If you only track “ChatGPT has the biggest share,” you miss the surfaces actually deciding whether buyers find you. The breakdown is what turns a statistic into a channel plan.
Three Kinds of Share That Don’t Match
Visibility share
Visibility share is how often your brand surfaces in AI answers across a platform. High usage on a platform means high exposure potential, but only if you appear in its answers.
Citation share
Citation share is how often a platform links or names sources, and which sources it favors. A platform with modest usage can carry outsized citation value if it sends real clicks.
Referral-traffic share
Referral-traffic share is the slice of your actual site visits coming from each AI surface. This is the one your analytics can confirm, and it rarely mirrors usage share.
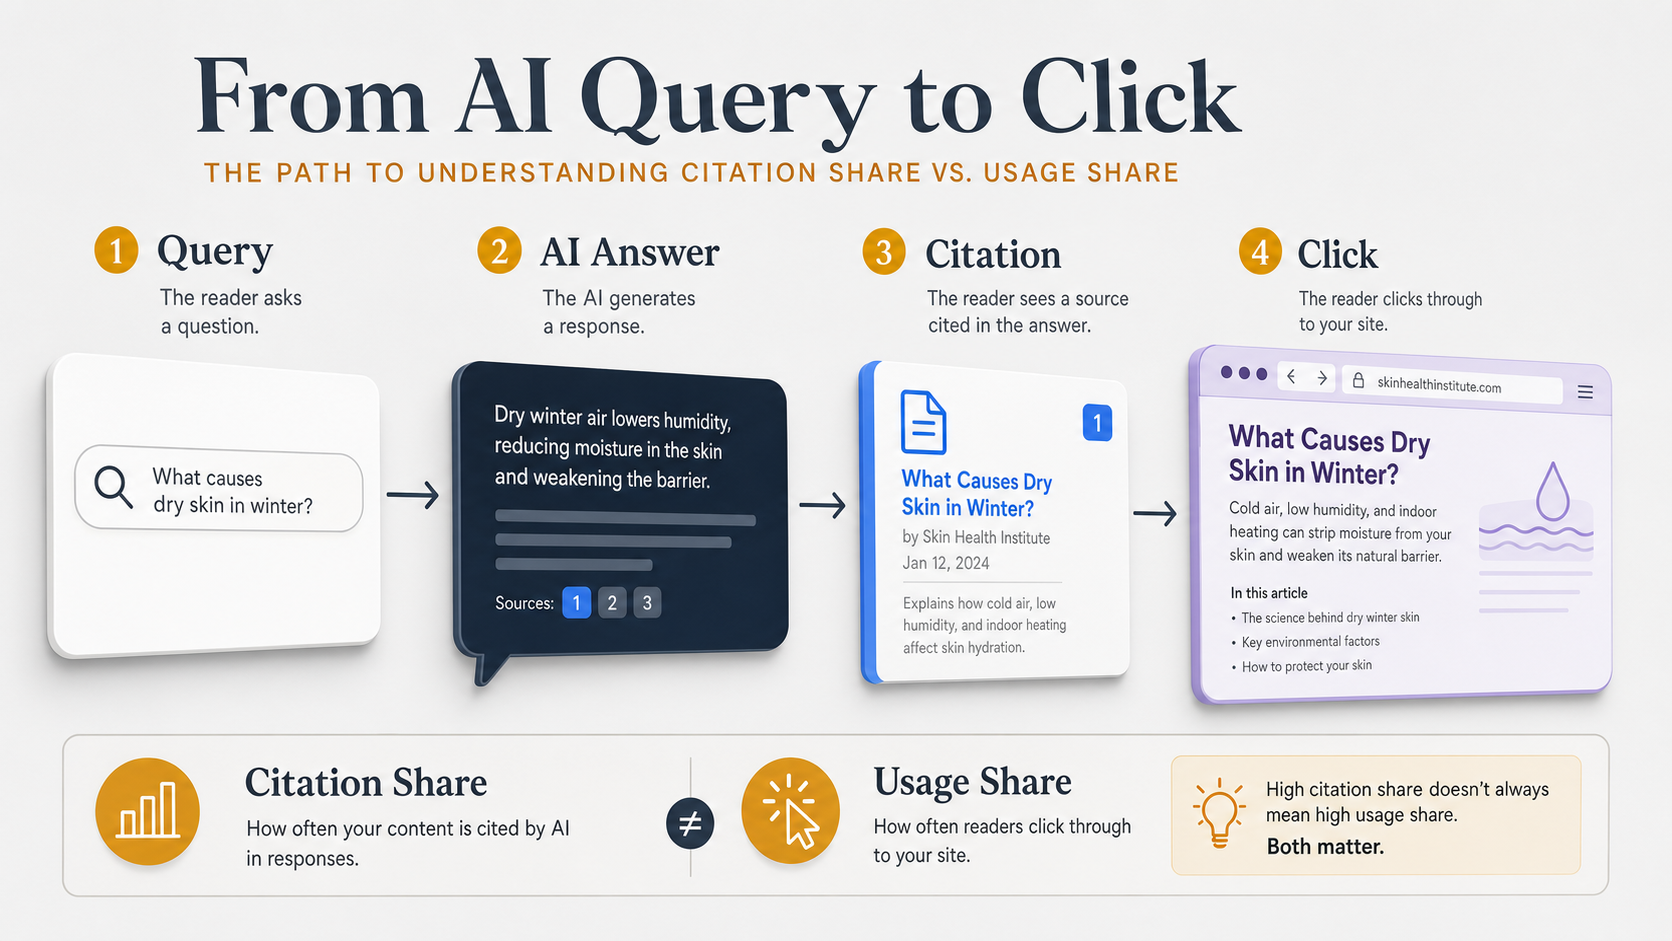
Here’s the practical payoff. A smaller platform can matter more than a larger one if it drives more citations or higher-intent visits. We’ve repeatedly seen a lower-share AI surface deliver a disproportionate share of branded mentions for a client, simply because its answer format names sources more often. Chasing the biggest usage number alone would have pointed that budget at the wrong place.
The data also shapes where you invest by audience. B2B buyers, ecommerce shoppers, and regulated-industry researchers lean on different AI surfaces, so a generic “optimize for ChatGPT” plan leaves gaps. If you’re building a tracking program, our guide on AI visibility vs SEO metrics covers which signals to watch beyond raw share.
The takeaway: track share by category, weigh citation value over raw usage, and match the surface to where your buyers actually search.
How AI Search Market Share Is Measured
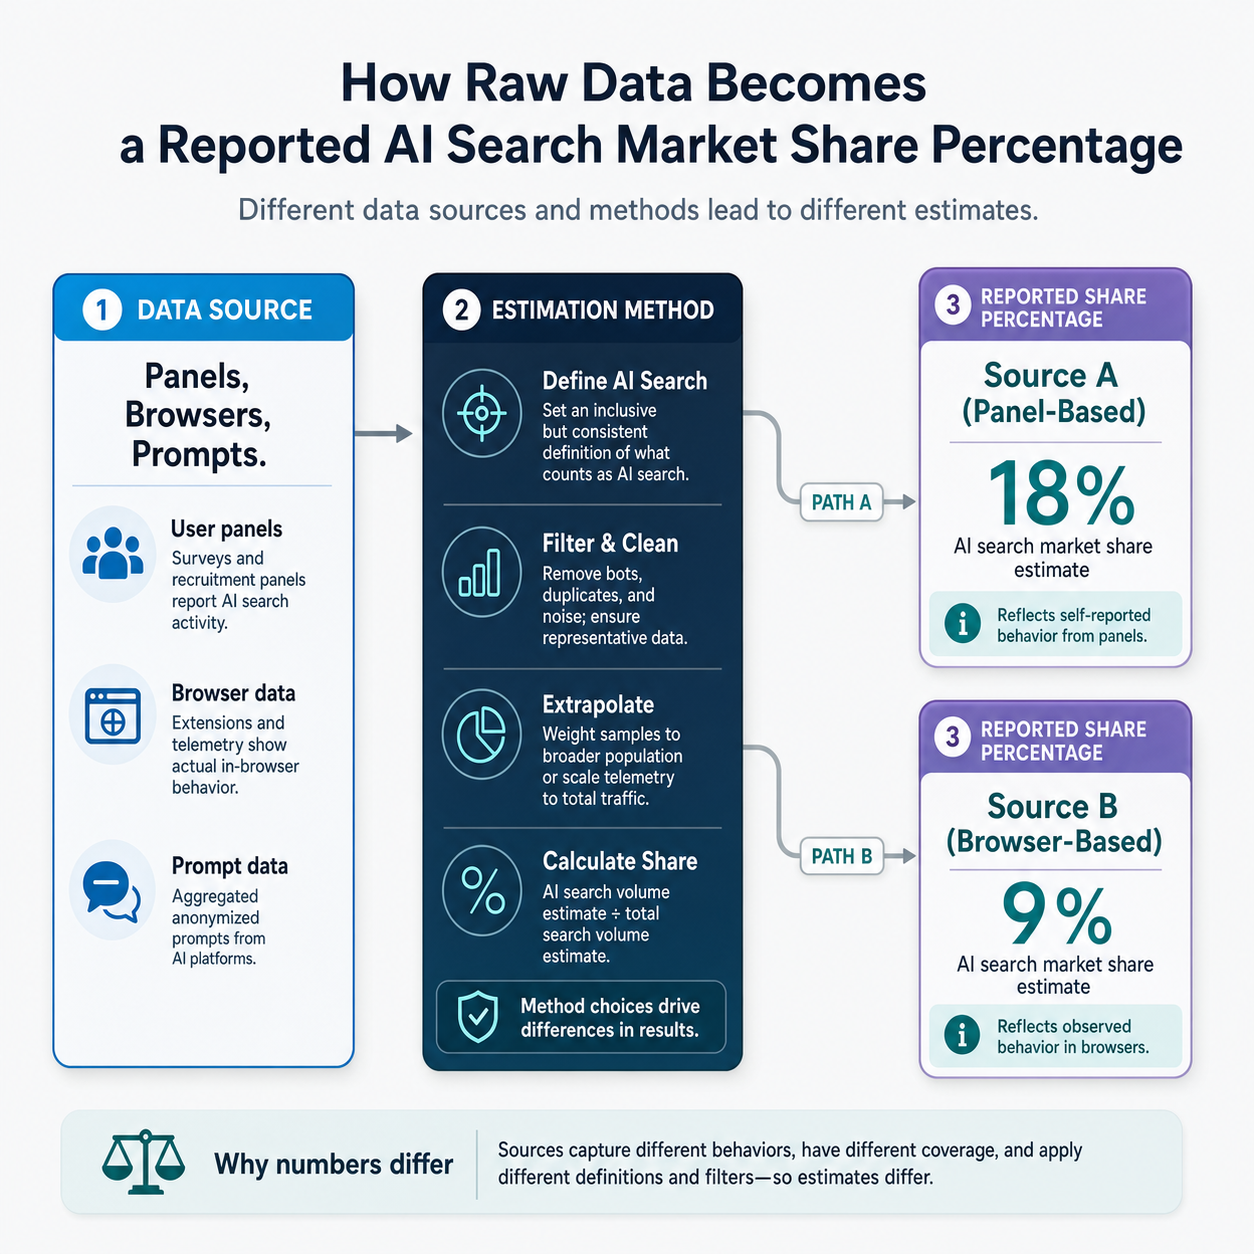
AI search market share is estimated through traffic panels, browser-based usage data, query-volume estimates, and chatbot interaction counts. No source has a complete census, so every figure is an approximation built on a different sample.
That’s why a StatCounter chart can show ChatGPT near 79% while a Similarweb-based pie chart shows it closer to 61% for the same broad period. They count different things.
What Each Method Actually Counts
| Method | What it measures | Main limitation |
|---|---|---|
| Traffic panels | Visits and sessions from a sampled user group | Sample skews by region and device |
| Browser-based usage | Page loads and active sessions on tracked browsers | Misses in-app and embedded usage |
| Query-volume estimates | Approximate prompt or search counts | Prompts and searches aren’t the same unit |
| Chatbot interaction data | Messages or conversations per platform | One conversation can equal many searches |
Prompts, Searches, Sessions, and Visits Are Different Units
A prompt is one message to a chatbot. A search is one query to a search engine. A session is a full visit that can hold many prompts or searches. A visit is a single page load.
Mixing these inflates or deflates a platform’s apparent share. One analysis that converted ChatGPT messages into “search-equivalent” interactions estimated Google’s daily search volume was hundreds of times larger than ChatGPT’s comparable activity. That math relied on rough proxies, treating messages as near-equivalent to searches, which is exactly the trap to avoid.
The Caveat to Hold
Usage share is not revenue share, and prompt volume is not search volume. Geography, device mix, and date range all move the final percentage. Treat any market-share figure as directional unless the source discloses a consistent sample and a clear method. Google and AI tools can’t be compared one to one on visits, page views, or prompts, because the underlying units don’t match.
AI Search Market Share by Platform
ChatGPT leads AI chatbot market share across nearly every published chart, with reported figures ranging from about 53% in some US-only studies to 79% in worldwide panels. The exact percentage depends on the source and geography, but the rank is consistent.
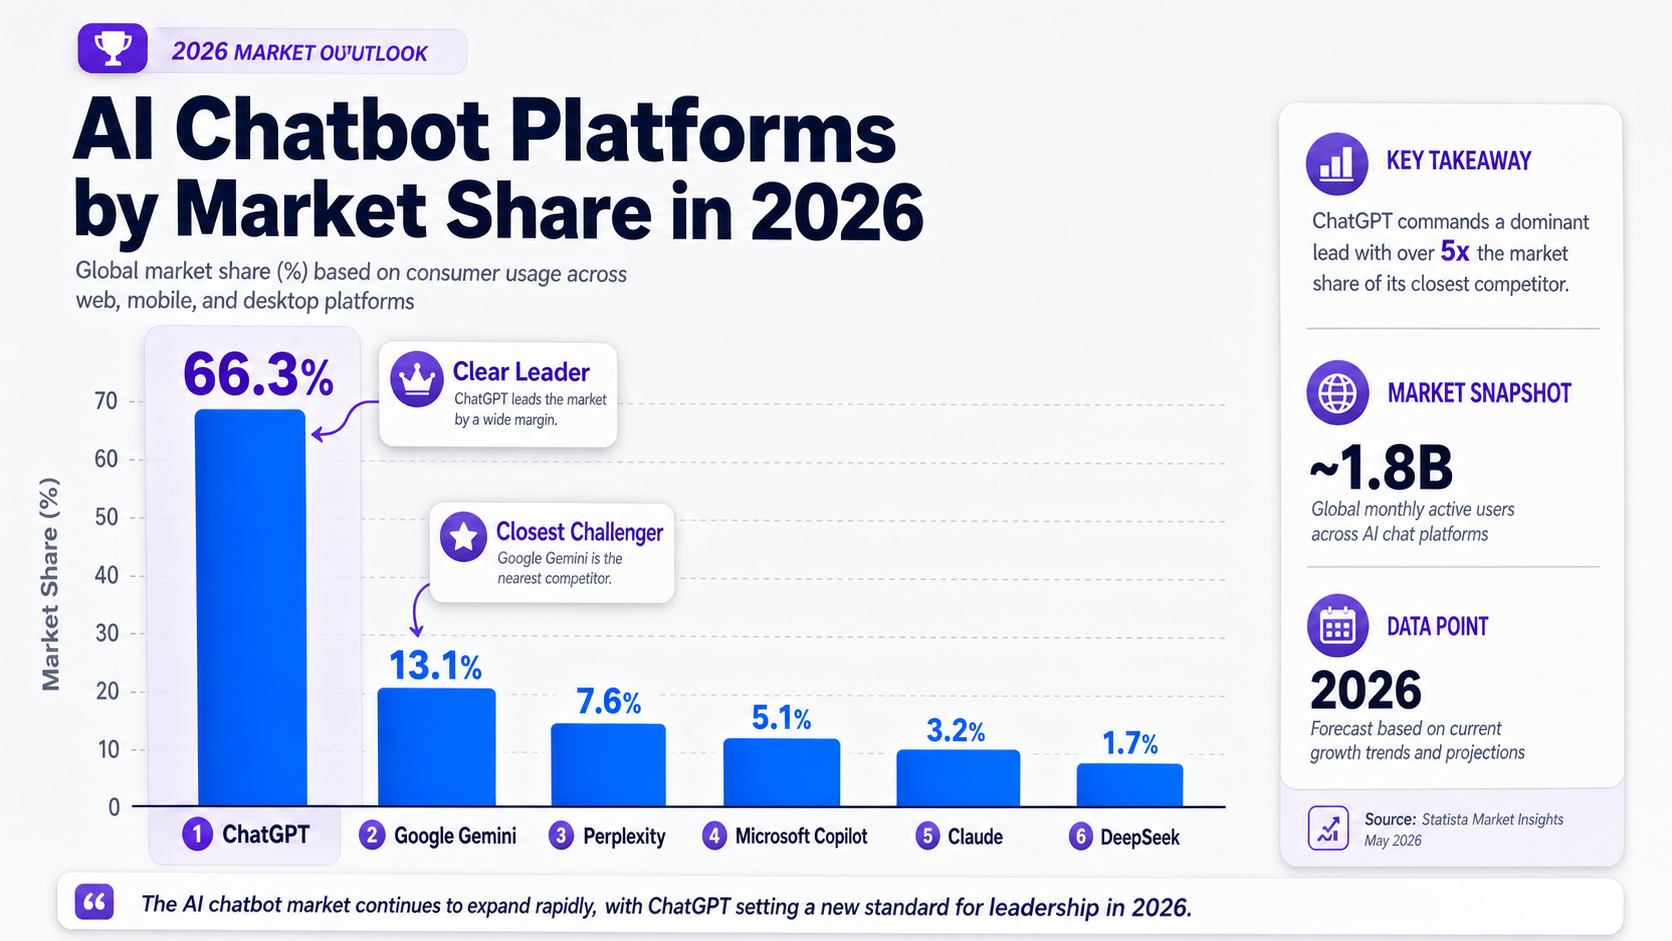
Here’s a consolidated platform snapshot drawn from 2026 reporting. Treat the percentages as directional, since each row may come from a panel with a different sample.
| Platform | Reported chatbot share range (2026) | Position |
|---|---|---|
| ChatGPT | ~53% to 79% | Clear leader |
| Google Gemini | ~7% to 25% | Close challenger |
| Perplexity | ~7% to 8% | Mid-tier, high citation value |
| Microsoft Copilot | ~3% to 9% | Steady, distribution-led |
| Claude | ~3% to 21% | Fast-growing in US data |
| DeepSeek | ~0.01% to small | Negligible to emerging |
ChatGPT leads most chatbot-share charts because it had the earliest mass adoption and the largest active user base, with reporting placing it above 400 million monthly active users. First-mover scale compounds into default-tool behavior, which keeps share high even as rivals improve.
One important separation. Google’s traditional search dominance, around 80% of all search, is counted apart from its AI-search share. When Gemini appears in a chatbot chart at single or low double digits, that figure says nothing about Google’s overall search position. The two live in different categories.
The ranges are wide for a reason. A worldwide StatCounter-style panel can put ChatGPT near 79%, while a US-only firstpagesage-style study can place it near 53% with Claude rising fast behind it. Same leader, different sample, different spread.
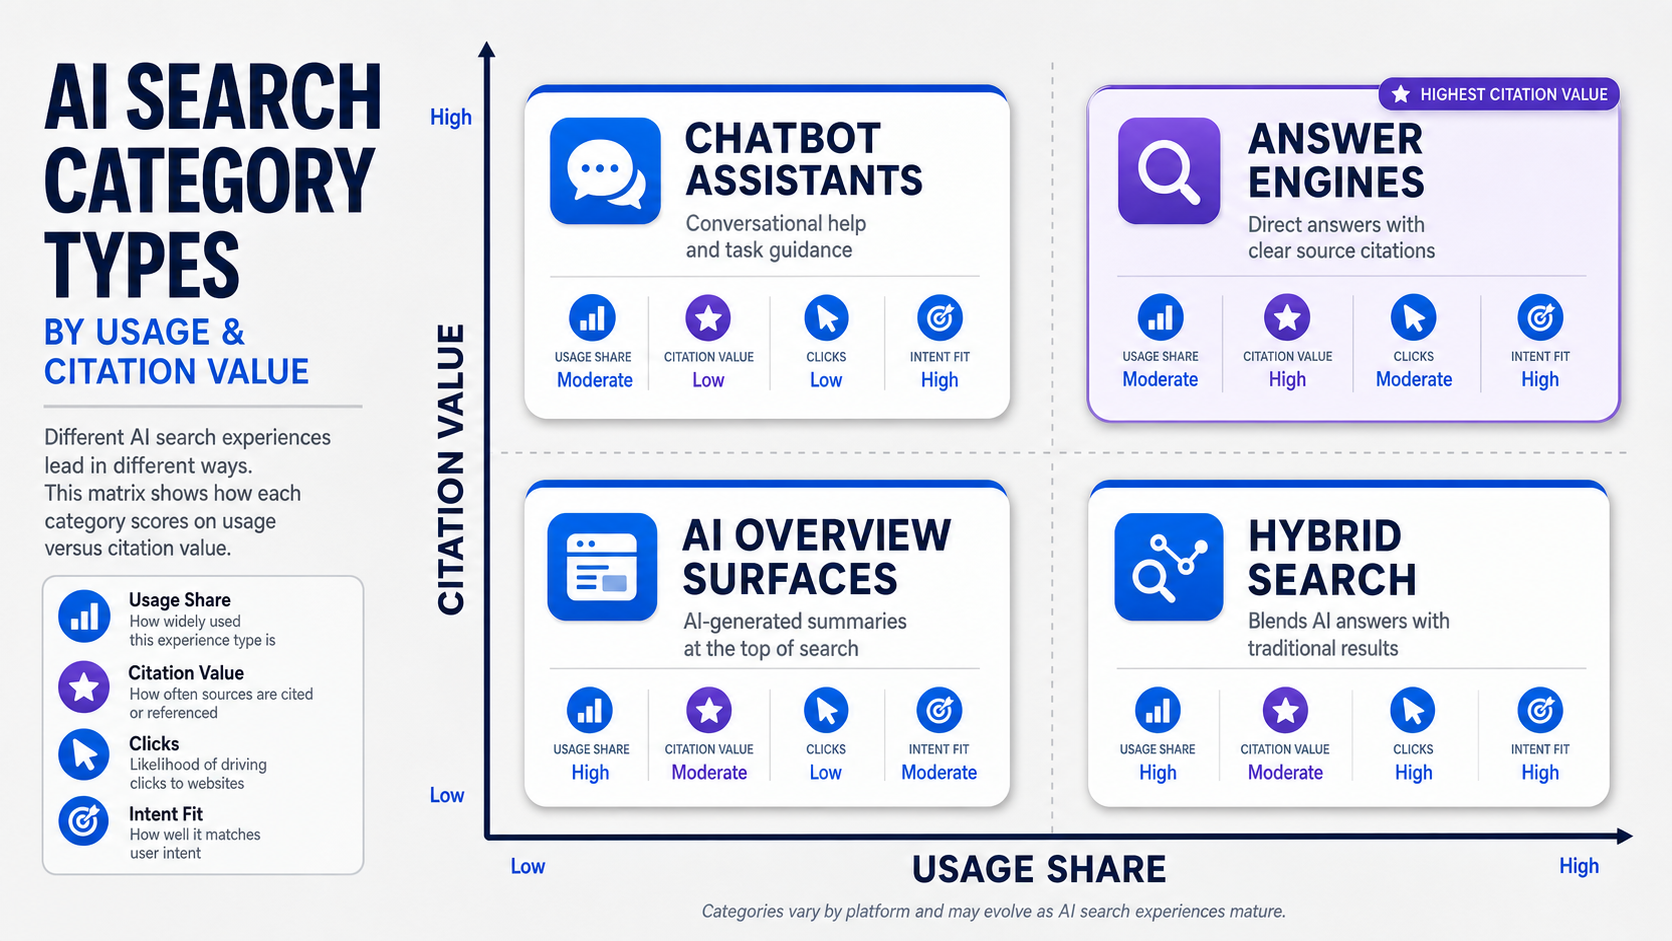
AI Search Market Share by Category Type
Category type splits the market into four product groups: chatbot assistants, answer engines, AI-overview surfaces, and hybrid search products. Each group behaves differently on usage, citations, and clicks, which is why one category can lead in raw usage while another leads in impressions or referrals.
How the Four Category Types Differ
| Category type | Example products | Best for | Where it leads |
|---|---|---|---|
| Chatbot assistants | ChatGPT, Claude, Gemini | Conversational lookup and task help | Raw usage and prompts |
| Answer engines | Perplexity | Source discovery with citations | Clicks to cited sources |
| AI-overview surfaces | Google AI Overviews, Google AI Mode | In-result answers inside search | Impressions and zero-click behavior |
| Hybrid search products | Copilot, ChatGPT Search | Chat plus live web retrieval | Mixed intent and task completion |
Why Usage and Citations Diverge by Category
Chatbot assistants win usage because people open them for everything from drafting to quick questions. But many of those conversations never cite a source or send a click, so usage share overstates their value to publishers.
AI-overview surfaces sit at the other end. Reporting suggests around half of Google searches already show an AI summary, with that figure projected to climb toward three-quarters by 2028. Those summaries generate enormous impressions while often keeping the click inside Google, which is the zero-click pattern.
Answer engines like Perplexity flip the script. Lower usage, higher citation density, more clicks per query to the sources they name. That’s the category divergence that matters most if your goal is earning real referrals rather than just exposure.
Treat Google’s AI Surfaces as Search, Not Standalone Rivals
Google AI Overviews and Google AI Mode are AI search surfaces inside Google, not separate competitors in every chart. Counting them as standalone chatbots double-counts Google and distorts the category picture. When you read a chatbot-share chart, Google’s overview surfaces usually aren’t in it at all.
Where Share Concentrates: Region, Device, and Time
AI search share concentrates in North America, skews earlier on desktop for research use, and is trending toward platform fragmentation over time as Gemini and Claude gain ground on ChatGPT. Each cut tells a different part of the story.
Region: North America Leads Adoption
North America holds the largest slice of the broader AI search engine market, with reporting placing the region around 40% of market revenue in 2025, driven by strong digital infrastructure and cloud adoption. Europe and Asia-Pacific follow, with Asia-Pacific often flagged as the fastest-growing region on a forward basis.
Regional concentration matters for rollout and localization. A platform that leads in North America may not lead in APAC, where local models and language coverage shift the mix. If your buyers sit outside North America, the headline US share charts will mislead you.
Device: Desktop Skews Toward Research
Desktop and mobile usage split by intent. Workplace research, longer prompts, and source-checking lean desktop. Quick consumer questions lean mobile. Market-share dashboards can be filtered by desktop, mobile, and tablet, and the platform mix changes when you do.
The practical read: AI search adoption often shows up first on desktop in North America, where professional research drives early usage. Mobile-heavy markets can tell a different story about which platform leads.
Time Period: From Concentration Toward Fragmentation
Over the trailing year, the trend is twofold. ChatGPT remains the leader, but several sources show its share softening as Gemini and Claude grow. AI search traffic as a whole has grown sharply, with one report citing a 527% year-over-year jump, and AI visits growing far faster than Google’s own search visits.

That movement tracks product launches and default placements more than steady organic drift. A new model release or a default-assistant deal can swing a month’s numbers, which is why time-period share is volatile and release-driven. Don’t read a single month as a permanent verdict.
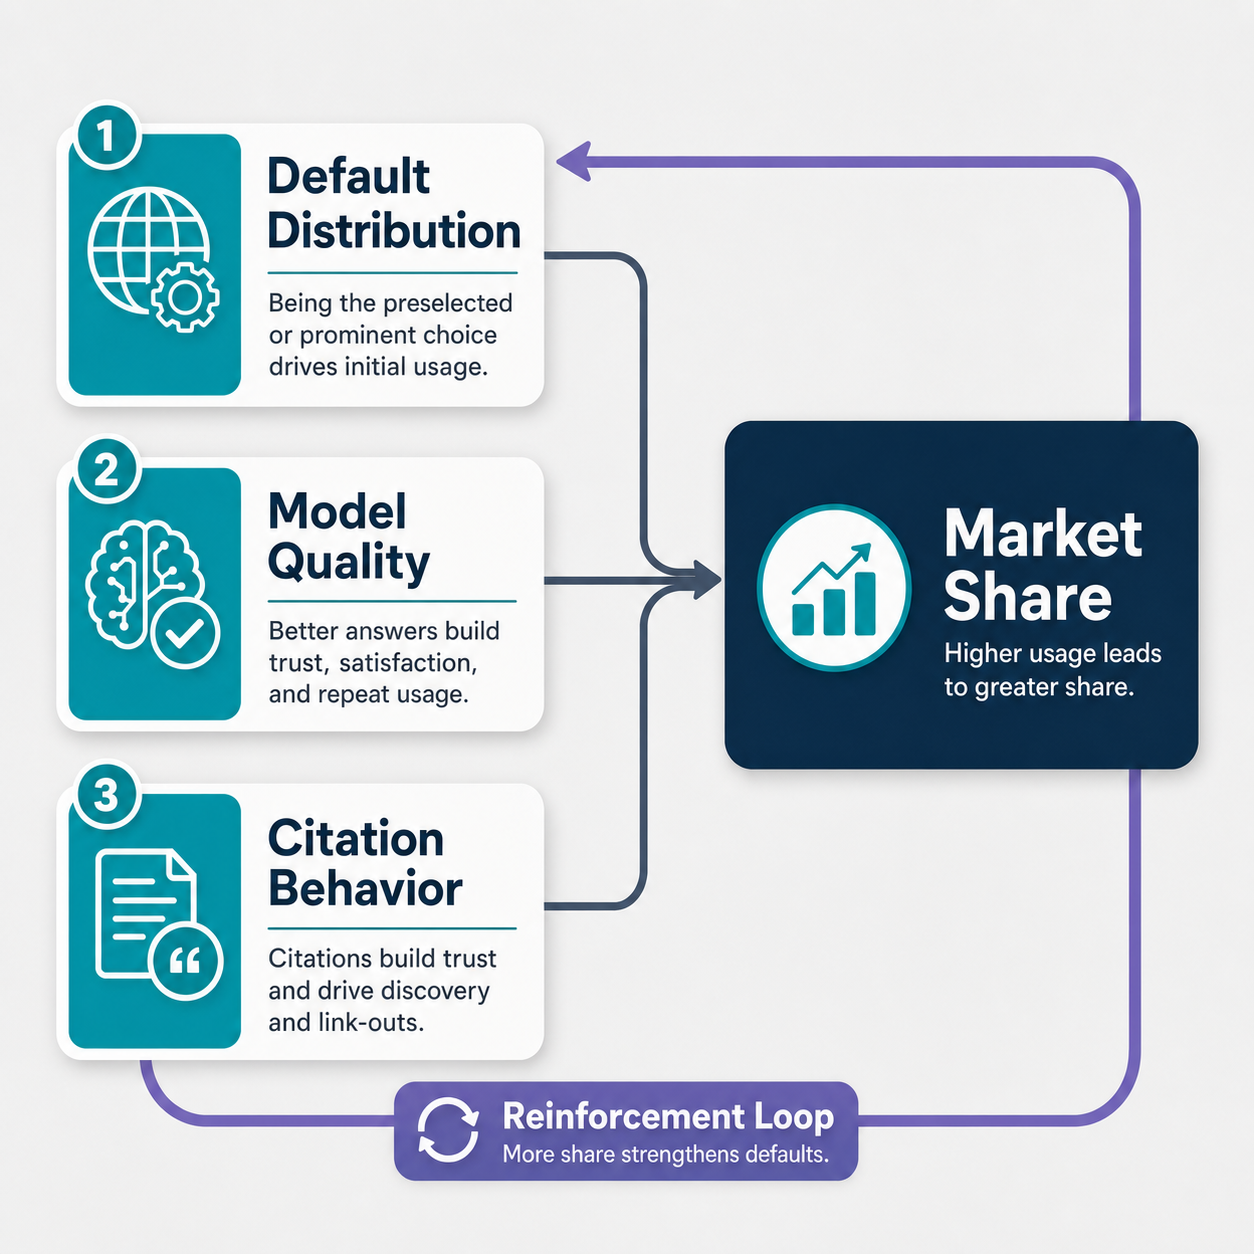
What Drives Share Changes and What Readers Misread
Share moves on five forces: model quality, default distribution, ecosystem lock-in, citation behavior, and integration with broader search. Most reader confusion comes from treating one number as if it captured all of them.
The Real Drivers Behind the Numbers
Default distribution is the quiet heavyweight. When an assistant ships as the default in a browser, phone, or operating system, its share climbs without any change in quality. Model quality matters too, but defaults convert idle users into active ones at scale.
Ecosystem lock-in keeps users where their accounts, history, and integrations already live. Citation behavior decides whether a platform sends clicks, which is what publishers feel. Integration with existing search, the way Google folds AI Overviews into results, lets a platform grow AI usage without launching a separate destination.
The Misconceptions Worth Correcting
Three misreadings show up constantly, and clearing them up is half the value of any share chart.
Prompts are not searches
A prompt and a search are different units, and one chatbot session can replace several searches or none. Converting prompts straight into “searches” overstates a chatbot’s reach against a search engine.
AI answers do not replace Google wholesale
Google’s search business kept growing even as AI tools rose, and Google can expand its own AI surfaces while standalone chatbots also grow. The two trends coexist rather than cancel out.
Usage share is not revenue share
A platform can lead usage while trailing on monetization, or vice versa. A usage-share chart says nothing about which company earns the most from AI search.
So the practical takeaway is simple. Track share by category and by source, not as a single topline number. The next variables to watch are platform defaults, regional rollouts, regulation, and the release-driven volatility that swings any single month. If you’re setting up monitoring across surfaces, our walkthrough on tracking your brand across 10 AI engines shows how to capture share at the category level rather than chasing one chart.
Frequently Asked Questions
What does AI search market share by category mean?
AI search market share by category means the breakdown of AI-powered search usage across distinct segments rather than a single number. The main categories are platform share, category-type share, region share, device share, and time-period trends. Each cut answers a different question, so a platform can lead one category and trail another. Reading the right category for your goal matters more than memorizing one headline percentage.
Which AI search platform has the highest market share?
ChatGPT has the highest AI chatbot market share in 2026, reported between roughly 53% and 79% depending on the source and geography. Google Gemini and Perplexity typically follow, with Claude rising quickly in some US-focused studies. The wide range reflects different measurement panels, not disagreement about the leader.
Is ChatGPT bigger than Google in AI search?
No, not in overall search. Google still handles roughly 80% of total search volume through traditional results plus AI Overviews. ChatGPT leads the narrower category of standalone AI chatbots, but that category is far smaller than Google’s total search footprint. The two compete in different segments, which is why both claims can be true at once.
How is AI search market share measured?
AI search market share is measured through traffic panels, browser-based usage estimates, query-volume approximations, and chatbot interaction counts. No source has a complete census, so every figure is a sampled estimate. Because vendors count different units, prompts, searches, sessions, and visits, the same month can show different percentages across StatCounter, Similarweb, and individual vendor reports. Treat the numbers as directional.
Does AI search share vary by region or device?
Yes. North America leads broader AI search adoption, holding around 40% of market revenue in 2025, while Asia-Pacific is often the fastest-growing region. Device matters too: desktop skews toward workplace research and longer queries, while mobile leans toward quick consumer questions. The leading platform can change when you filter by region or device, so a single global chart can hide meaningful local differences.
The honest read on all this: there is no one AI search market share number, and any source that gives you one is hiding the category problem. ChatGPT leads chatbots, Google leads total search, Perplexity punches above its usage on citations, and the whole board reshuffles by region, device, and month. Track share by category and by source if you want to see where visibility is actually shifting, because the topline number is the least useful figure you can pull.